Energy in Belarus
Energy in Belarus describes energy and electricity production, consumption and import in Belarus. Belarus is a net energy importer. According to IEA, the energy import exceeded the energy use in 2008. Primary energy use in Belarus was 327 TWh or 34 TWh per million persons in 2008.[1]


Primary energy use per capita in Belarus in 2009 (34 MWh) was slightly more than in Portugal (26 MWh) and about half of the use in Belgium (64 MWh) or Sweden (62 MWh).[1]
Overview
| Population (million) |
Prim. energy (TWh) |
Production (TWh) |
Import (TWh) |
Electricity (TWh) |
CO2-emission (Mt) | |
|---|---|---|---|---|---|---|
| 2004 | 9.82 | 311 | 42 | 272 | 30.9 | 60.6 |
| 2007 | 9.70 | 326 | 47 | 276 | 32.5 | 62.7 |
| 2008 | 9.68 | 327 | 47 | 287 | 33.2 | 64.2 |
| 2009 | 9.66 | 311 | 47 | 258 | 31.4 | 60.8 |
| 2012 | 9.47 | 343 | 50 | 286 | 34.4 | 66.0 |
| 2012R | 9.46 | 355 | 47.9 | 309 | 35.0 | 71.1 |
| 2013 | 9.47 | 317 | 46.4 | 274 | 34.5 | 58.3 |
| Change 2004-09 | -1.6% | -0.1% | 11.9% | -5.0% | 1.6% | 0.2% |
| Mtoe = 11.63 TWh, Prim. energy includes energy losses [3]
2012R = CO2 calculation criteria changed, numbers updated | ||||||
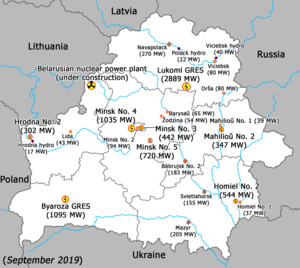
Power plants
| Name | Region/city | Capacity, MW[4] |
|---|---|---|
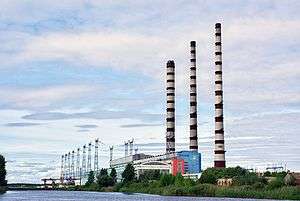
| Lukoml GRES | Viciebsk Region | 2,889 |
| Byaroza GRES | Brest Region | 1,095 |
| Minsk thermal No. 4 | Minsk city | 1,035 |
| Minsk thermal No. 5 | Minsk Region | 719.6 |
| Homiel thermal No. 2 | Homiel city | 544 |
| Minsk thermal No. 3 | Minsk city | 442 |
| Mahilioŭ thermal No. 2 | Mahilioŭ city | 347 |
| Hrodna thermal No. 2 | Hrodna city | 302.5 |
| Navapolack thermal | Navapolack city | 270 |
| Mazyr thermal | Mazyr city | 205 |
| Babruysk thermal No. 2 | Babruysk city | 182.6 |
| Svietlahorsk thermal | Svietlahorsk city | 155 |
| Minsk thermal No. 2 | Minsk city | 94 |
| Viciebsk thermal | Viciebsk city | 80 |
| Orša thermal | Orša city | 79.8 |
| Barysaŭ thermal | Barysaŭ city | 65 |
| Žodzina thermal | Žodzina city | 54 |
| Lida thermal | Lida city | 43 |
| Viciebsk hydro | Viciebsk Region | 40 |
| Mahilioŭ thermal No. 1 | Mahilioŭ city | 38.5 |
| Homiel thermal No. 1 | Homiel city | 37.3 |
| Žlobin thermal | Žlobin city | 26.2 |
| Pinsk thermal | Pinsk city | 22 |
| Polack hydro | Viciebsk Region | 21.7 |
| Mahilioŭ thermal No. 3 | Mahilioŭ city | 19.5 |
| Baranavičy thermal | Baranavičy city | 18 |
| Hrodna hydro | Hrodna Region | 17 |
| Brest thermal | Brest city | 12 |
| Babruysk thermal No. 1 | Babruysk city | 12 |
The Astravets Nuclear Power Plant is under construction, with the first unit of two expected to come online in 2020.[5]
Oil

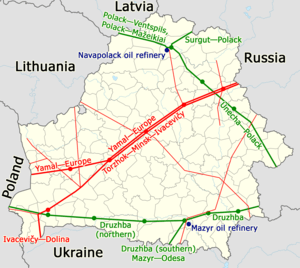
Belarus has two refineries and oil pipelines built during the Soviet era including the Mozyr Oil Refinery.
Renewable energy
Renewable energy is a target, and Belarus has a goal to reach 6% generation from renewable energy sources by 2035 (compared to 0.41% in 2013). To support development, private sector developers are eligible for feed-in tariffs to support a wide range of renewable energy sources.
Solar power
Wind power
Hydroelectricity
- Hydroelectricity in Belarus
See also
| Wikimedia Commons has media related to Energy in Belarus. |
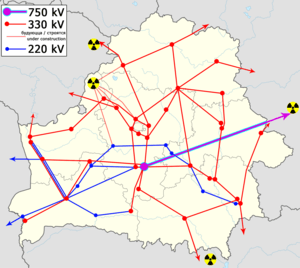
- Map of Belarusian power grids
- Druzhba pipeline
- 2004 Russia–Belarus gas dispute
- 2007 Russia–Belarus energy dispute
References
- IEA Key energy statistics 2010 Page: Country specific indicator numbers from page 48
- IEA Key World Energy Statistics Statistics 2015, 2014 (2012R as in November 2015 + 2012 as in March 2014 is comparable to previous years statistical calculation criteria, 2013, 2012, 2011, 2010, 2009 Archived 2013-10-07 at the Wayback Machine, 2006 Archived 2009-10-12 at the Wayback Machine IEA October, crude oil p.11, coal p. 13 gas p. 15
- Energy in Sweden 2010 Archived October 16, 2013, at the Wayback Machine. Facts and figures. The Swedish Energy Agency. Table 8 Losses in nuclear power stations Table 9 Nuclear power brutto
- Установленная мощность, кВт (in Russian)
- "Hot tests completed at Ostrovets unit 1". World Nuclear News. 16 April 2020. Retrieved 3 May 2020.

.svg.png)
.svg.png)