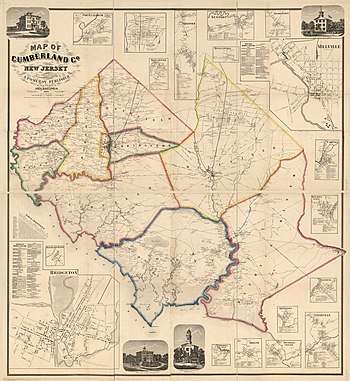
Cumberland County, New Jersey
Cumberland County is a county located in the U.S. state of New Jersey. As of the 2019 Census estimate, the county's population was 149,527, making it the state's 16th-largest county,[2][3][4] representing a 2.8% decrease from the 156,898 enumerated at the 2010 United States Census,[5] in turn increasing by 10,460 (+7.1%) from the 146,438 counted in the 2000 Census,[6] retaining its position as the state's 16th-most populous county.[7][8] Its county seat is Bridgeton.[1] Cumberland County is named for Prince William, Duke of Cumberland.[9][10] The county was formally created from portions of Salem County as of January 19, 1748.[11]
Cumberland County | |
|---|---|
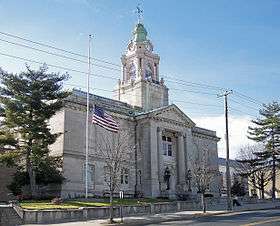
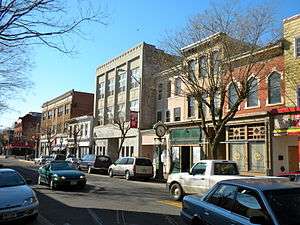 Downtown Bridgeton | |
 Flag  Seal | |
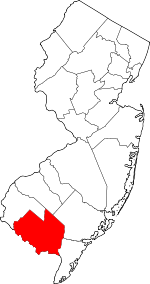 Location within the U.S. state of New Jersey | |
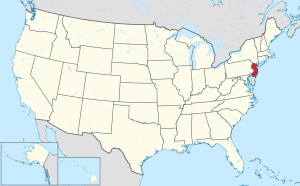 New Jersey's location within the U.S. | |
| Coordinates: 39.33°N 75.13°W | |
| Country | |
| State | |
| Founded | 1748 |
| Named for | Prince William, Duke of Cumberland |
| Seat | Bridgeton[1] |
| Largest municipality | Vineland (population) Maurice River Township (area) |
| Government | |
| • Freeholder director | Joseph Derella Jr. (D, term ends December 31, 2017) |
| Area | |
| • Total | 677.62 sq mi (1,755.0 km2) |
| • Land | 483.70 sq mi (1,252.8 km2) |
| • Water | 193.92 sq mi (502.3 km2) 28.62% |
| Population (2010) | |
| • Total | 156,898 |
| • Estimate (2019) | 149,527 |
| • Density | 230/sq mi (89/km2) |
| Congressional district | 2nd |
| Website | www |
This county is part of the Vineland-Millville-Bridgeton Primary Metropolitan Statistical Area[12] as well as the Delaware Valley Combined Statistical Area.[13]
Geography
According to the 2010 Census, the county had a total area of 677.62 square miles (1,755.0 km2), including 483.70 square miles (1,252.8 km2) of land (71.4%) and 193.92 square miles (502.3 km2) of water (28.6%).[14]
Cumberland is a low-lying, generally featureless coastal county, with many salt marshes near the Delaware Bay. The highest elevation is at one of 12 areas in Upper Deerfield Township that stand approximately 140 feet (43 m) above sea level;[15] the lowest elevation is sea level.
Adjacent counties
- Gloucester County – north
- Atlantic County – northeast
- Cape May County – southeast
- Kent County, Delaware – southwest1
- Salem County – northwest
1across Delaware Bay; no land border
Demographics
| Historical population | |||
|---|---|---|---|
| Census | Pop. | %± | |
| 1790 | 8,248 | — | |
| 1800 | 9,529 | 15.5% | |
| 1810 | 12,670 | 33.0% | |
| 1820 | 12,668 | 0.0% | |
| 1830 | 14,093 | 11.2% | |
| 1840 | 14,374 | 2.0% | |
| 1850 | 17,189 | 19.6% | |
| 1860 | 22,605 | 31.5% | |
| 1870 | 34,665 | 53.4% | |
| 1880 | 37,687 | 8.7% | |
| 1890 | 45,438 | 20.6% | |
| 1900 | 51,193 | 12.7% | |
| 1910 | 55,153 | 7.7% | |
| 1920 | 61,348 | 11.2% | |
| 1930 | 69,895 | 13.9% | |
| 1940 | 73,184 | 4.7% | |
| 1950 | 88,597 | 21.1% | |
| 1960 | 106,850 | 20.6% | |
| 1970 | 121,374 | 13.6% | |
| 1980 | 132,866 | 9.5% | |
| 1990 | 138,053 | 3.9% | |
| 2000 | 146,438 | 6.1% | |
| 2010 | 156,898 | 7.1% | |
| Est. 2019 | 149,527 | [16] | −4.7% |
| Historical sources: 1790-1990[17] 1970-2010[8] 2000[6] 2010[5] | |||
2010 Census
The 2010 United States Census counted 156,898 people, 51,931 households, and 36,559.424 families in the county. The population density was 324.4 per square mile (125.3/km2). There were 55,834 housing units at an average density of 115.4 per square mile (44.6/km2). The racial makeup was 62.74% (98,430) White, 20.23% (31,741) Black or African American, 1.11% (1,746) Native American, 1.22% (1,907) Asian, 0.04% (59) Pacific Islander, 11.15% (17,492) from other races, and 3.52% (5,523) from two or more races. Hispanic or Latino of any race were 27.06% (42,457) of the population.[5]
Of the 51,931 households, 31.4% had children under the age of 18; 45.2% were married couples living together; 18.6% had a female householder with no husband present and 29.6% were non-families. Of all households, 24% were made up of individuals and 10.8% had someone living alone who was 65 years of age or older. The average household size was 2.79 and the average family size was 3.26.[5]
24% of the population were under the age of 18, 9.5% from 18 to 24, 28.5% from 25 to 44, 25.3% from 45 to 64, and 12.6% who were 65 years of age or older. The median age was 36.5 years. For every 100 females, the population had 106.2 males. For every 100 females ages 18 and older there were 106.9 males.[5]
2000 Census
As of the 2000 United States Census[18] there were 146,438 people, 49,143 households, and 35,186 families residing in the county. The population density was 299 people per square mile (116/km²). There were 52,863 housing units at an average density of 108 per square mile (42/km²). The racial makeup of the county was 65.88% White, 20.20% Black or African American, 0.97% Native American, 0.95% Asian, 0.06% Pacific Islander, 9.08% from other races, and 2.85% from two or more races. 19.00% of the population were Hispanic or Latino of any race.[6][19] Among those residents listing their ancestry, 15.6% of residents were of Italian, 12.1% German, 10.7% Irish and 8.4% English ancestry.[19][20]
There were 49,143 households out of which 34.10% had children under the age of 18 living with them, 48.70% were married couples living together, 17.30% had a female householder with no husband present, and 28.40% were non-families. 23.60% of all households were made up of individuals and 11.10% had someone living alone who was 65 years of age or older. The average household size was 2.73 and the average family size was 3.19.[6]
In the county, the population was spread out with 25.40% under the age of 18, 8.50% from 18 to 24, 31.20% from 25 to 44, 21.90% from 45 to 64, and 13.00% who were 65 years of age or older. The median age was 36 years. For every 100 females there were 104.20 males. For every 100 females age 18 and over, there were 103.50 males.[6]
The median income for a household in the county was $39,150, and the median income for a family was $45,403. Males had a median income of $35,387 versus $25,393 for females. The per capita income for the county was $17,376. About 11.3% of families and 15.0% of the population were below the poverty line, including 20.1% of those under age 18 and 12.9% of those age 65 or over.[19][21]
Economy
Based on data from the Bureau of Economic Analysis, Cumberland County had a gross domestic product (GDP) of $6.1 billion in 2018, which was ranked 17th in the state and represented an increase of 1.6% from the previous year.[22]
Government
County
Cumberland County is governed by a Board of Chosen Freeholders consisting of seven members. Each Freeholder is assigned responsibility for one of the county's departments. These individuals are elected at large by the citizens of Cumberland County in partisan elections and serve staggered three-year terms in office, with either two or three seats coming up for election each year in a three-year cycle.[23] In 2016, freeholders were paid $15,000 and the freeholder director was paid an annual salary of $16,000.[24]
As of 2018, members of the Cumberland County Board of Chosen Freeholders (with party affiliation, residence and term-end year listed in parentheses) are:[25][26][27][28][29][30]
- Freeholder Director Joseph Derella Jr. (D, Millville, term as freeholder and as freeholder director ends December 31, 2018)[31]
- Deputy Freeholder Director Darlene R. Barber (D, Upper Deerfield Township, term as freeholder ends 2019, term as deputy freeholder director ends 2018)[32]
- George Castellini (D, Vineland, 2020)[33]
- Carol Musso (D, Deerfield Township, 2020)[34]
- James F. Quinn (D, Millville, 2018)[35]
- Joseph V. Sparacio (R, Deerfield Township, 2019)[36]
- Jack Surrency (D, Bridgeton 2020)[37]
Then-Freeholder Director Bill Whelan, whose term was to run to December 2014, announced in July 2013 that he was resigning from office.[38] Later that month, Joe Derella was chosen to replace Whelan as director, while the vacant seat was filled by Vineland resident Carlos Mercado.[39]
Freeholder Louis N. Magazzu, whose term was to expire in 2012, announced his resignation in August 2011.[40]
Pursuant to Article VII Section II of the New Jersey State Constitution, each county in New Jersey is required to have three elected administrative officials known as "constitutional officers." These officers are the County Clerk and County Surrogate (both elected for five-year terms of office) and the County Sheriff (elected for a three-year term).[41] Cape May's Constitutional offers are:[26]
- Clerk Celeste Riley (D, Bridgeton, 2019)[42][43]
- Sheriff Robert A. Austino (D, Vineland, 2020)[44][45]
- Surrogate Douglas M. Rainear (D, Upper Deerfield Township, 2018).[46][47]
The Cumberland County Prosecutor is Jennifer Webb-McRae of Vineland. First nominated by Governor of New Jersey Jon Corzine in January 2010, Webb-McRae was nominated for a second five-year term by Chris Christie in November 2016 and sworn into office after confirmation in January 2017.[48][49]
Cumberland County is a part of Vicinage 15 of the New Jersey Superior Court (along with Gloucester County and Salem County), seated in Woodbury in Gloucester County; the Assignment Judge for the vicinage is Benjamin C. Telsey. The Cumberland County Courthouse is in Bridgeton.[50]
Federal and state representation
The 2nd Congressional District includes all of Cumberland County.[51][52] For the 116th United States Congress, New Jersey's Second Congressional District is represented by Jeff Van Drew (R, Dennis Township).[53]
The county is part of the 1st and 3rd Districts in the New Jersey Legislature.[54] For the 2020–2021 session (Senate, General Assembly), the 1st Legislative District of the New Jersey Legislature is represented in the State Senate by Mike Testa (R, Vineland) and in the General Assembly by Antwan McClellan (R, Ocean City) and Erik K. Simonsen (R, Lower Township).[55][56] For the 2018–2019 session (Senate, General Assembly), the 3rd Legislative District of the New Jersey Legislature is represented in the State Senate by Stephen M. Sweeney (D, West Deptford Township) and in the General Assembly by John J. Burzichelli (D, Paulsboro) and Adam Taliaferro (D, Woolwich Township).[57][58]
The New Jersey Department of Corrections operates three correctional facilities in the county. They are Bayside State Prison, South Woods State Prison, and Southern State Correctional Facility. In 2007, while the state was preparing to close Riverfront State Prison in Camden, it considered establishing a fourth state prison in Cumberland County.[59]
Politics
Cumberland County tends to lean towards the Democratic party. In the 2004 U.S. presidential election, John Kerry carried the county by a 6.6% margin over George W. Bush.[60]
| Year | Republican | Democratic | Third parties |
|---|---|---|---|
| 2016 | 45.0% 24,453 | 51.1% 27,771 | 3.9% 2,107 |
| 2012 | 37.3% 20,658 | 61.5% 34,055 | 1.2% 656 |
| 2008 | 38.4% 22,360 | 60.0% 34,919 | 1.6% 915 |
| 2004 | 45.8% 24,362 | 52.4% 27,875 | 1.8% 948 |
| 2000 | 38.8% 18,882 | 57.9% 28,188 | 3.3% 1,614 |
| 1996 | 31.7% 14,744 | 54.7% 25,444 | 13.6% 6,345 |
| 1992 | 36.9% 19,253 | 42.6% 22,220 | 20.4% 10,643 |
| 1988 | 53.8% 26,024 | 45.2% 21,869 | 0.9% 456 |
| 1984 | 57.5% 29,398 | 41.3% 21,141 | 1.2% 616 |
| 1980 | 50.1% 23,242 | 41.7% 19,356 | 8.2% 3,805 |
| 1976 | 40.8% 20,535 | 58.0% 29,165 | 1.2% 587 |
| 1972 | 58.2% 26,409 | 41.2% 18,692 | 0.6% 291 |
| 1968 | 40.4% 18,388 | 47.6% 21,661 | 12.0% 5,439 |
| 1964 | 27.3% 12,611 | 72.7% 33,593 | 0.0% 11 |
| 1960 | 47.8% 21,283 | 52.1% 23,199 | 0.1% 30 |
| 1956 | 58.1% 24,067 | 41.8% 17,309 | 0.2% 68 |
| 1952 | 53.4% 21,819 | 46.3% 18,929 | 0.3% 111 |
| 1948 | 51.2% 16,556 | 47.0% 15,195 | 1.7% 562 |
| 1944 | 47.9% 14,477 | 51.9% 15,674 | 0.2% 67 |
| 1940 | 45.8% 16,322 | 54.0% 19,251 | 0.3% 107 |
| 1936 | 41.1% 14,500 | 58.1% 20,492 | 0.9% 300 |
| 1932 | 55.6% 16,668 | 41.3% 12,371 | 3.1% 932 |
| 1928 | 77.9% 23,921 | 21.8% 6,694 | 0.3% 84 |
| 1924 | 71.1% 15,691 | 21.6% 4,780 | 7.3% 1,613 |
| 1920 | 68.4% 11,913 | 25.8% 4,487 | 5.9% 1,027 |
| 1916 | 52.1% 5,692 | 41.9% 4,573 | 6.0% 652 |
| 1912 | 18.2% 1,895 | 37.0% 3,858 | 44.8% 4,671 |
| 1908 | 56.6% 6,770 | 37.8% 4,521 | 5.7% 679 |
| 1904 | 64.3% 7,402 | 28.8% 3,317 | 6.9% 796 |
| 1900 | 58.7% 6,780 | 34.9% 4,036 | 6.4% 744 |
| County CPVI: D+6 | |||
Municipalities
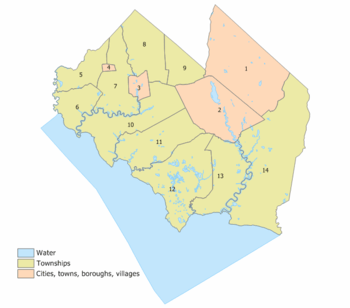
Municipalities in Cumberland County (with most 2010 Census data for population, housing units and area) are:[62]
| Municipality (with map key) |
Municipal type |
Population | Housing Units |
Total Area |
Water Area |
Land Area |
Pop. Density |
Housing Density |
Communities |
|---|---|---|---|---|---|---|---|---|---|
| Bridgeton (3) | city | 25,349 | 6,782 | 6.43 | 0.25 | 6.18 | 4,102.5 | 1,097.6 | |
| Commercial Township (13) | township | 5,178 | 2,115 | 34.44 | 2.31 | 32.13 | 161.2 | 65.8 | Buckshutem Haleyville Laurel Lake (2,929) Mauricetown North Port Norris Port Norris (1,377) |
| Deerfield Township (9) | township | 3,119 | 1,143 | 16.80 | 0.03 | 16.76 | 186.1 | 68.2 | Rosenhayn (1,098) |
| Downe Township (12) | township | 1,585 | 996 | 54.27 | 5.66 | 48.61 | 32.6 | 20.5 | Dividing Creek Dragston Fortescue Newport |
| Fairfield Township (10) | township | 6,295 | 2,058 | 43.95 | 2.69 | 41.26 | 152.6 | 49.9 | Fairton (1,264) Sea Breeze |
| Greenwich Township (6) | township | 804 | 369 | 18.83 | 1.00 | 17.84 | 45.1 | 20.7 | Othello Springtown |
| Hopewell Township (7) | township | 4,571 | 1,741 | 30.83 | 0.95 | 29.87 | 153.0 | 58.3 | Bowentown Cohansey |
| Lawrence Township (11) | township | 3,290 | 1,221 | 38.33 | 1.41 | 36.92 | 89.1 | 33.1 | Cedarville (776) |
| Maurice River Township (14) | township | 7,976 | 1,506 | 95.76 | 2.65 | 93.11 | 85.7 | 16.2 | Bennetts Mill Cumberland Delmont Dorchester Heislerville Hesstown Leesburg Manumuskin Port Elizabeth |
| Millville (2) | city | 28,400 | 11,435 | 44.49 | 2.49 | 42.00 | 676.2 | 272.3 | |
| Shiloh (4) | borough | 516 | 214 | 1.21 | 0.00 | 1.21 | 427.3 | 177.2 | |
| Stow Creek Township (5) | township | 1,431 | 568 | 18.85 | 0.55 | 18.30 | 78.2 | 31.0 | Garrison Corner Jericho Kernan Corner Roadstown |
| Upper Deerfield Township (8) | township | 7,660 | 3,025 | 31.27 | 0.18 | 31.10 | 246.3 | 97.3 | Deerfield Seabrook Seabrook Farms (1,484) |
| Vineland (1) | city | 60,724 | 22,661 | 69.03 | 0.61 | 68.42 | 887.5 | 331.2 | |
| Cumberland County | county | 156,898 | 55,834 | 677.62 | 193.92 | 483.70 | 324.4 | 115.4 | |
Transportation
Airports
The following public-use airports are located in Cumberland County:
- Bucks Airport (00N) in Bridgeton
- Millville Municipal Airport (MIV) in Millville
- Kroelinger Airport (29N) in Vineland
Roads and highways
As of 2010, the county had a total of 1,271.74 miles (2,046.67 km) of roadways, of which 643.65 miles (1,035.85 km) were maintained by the local municipality, 539.14 miles (867.66 km) by Cumberland County and 88.95 miles (143.15 km) by the New Jersey Department of Transportation.[63]
Cumberland is served only by state and county routes. Major county routes that pass through include County Route 540, County Route 548 (only in Maurice River Township), County Route 550, County Route 552, County Route 553 and County Route 555.
State routes include Route 47, Route 49, Route 55, Route 56, Route 77 and Route 347.
Route 55 is the only limited access road in the county which provides access to I-76, Interstate 295, and the Philadelphia area to the north.
Climate and weather
| Bridgeton, New Jersey | ||||||||||||||||||||||||||||||||||||||||||||||||||||||||||||
|---|---|---|---|---|---|---|---|---|---|---|---|---|---|---|---|---|---|---|---|---|---|---|---|---|---|---|---|---|---|---|---|---|---|---|---|---|---|---|---|---|---|---|---|---|---|---|---|---|---|---|---|---|---|---|---|---|---|---|---|---|
| Climate chart (explanation) | ||||||||||||||||||||||||||||||||||||||||||||||||||||||||||||
| ||||||||||||||||||||||||||||||||||||||||||||||||||||||||||||
| ||||||||||||||||||||||||||||||||||||||||||||||||||||||||||||
In recent years, average temperatures in the county seat of Bridgeton have ranged from a low of 25 °F (−4 °C) in January to a high of 87 °F (31 °C) in July, although a record low of −13 °F (−25 °C) was recorded in January 1985 and a record high of 101 °F (38 °C) was recorded in July 1966. Average monthly precipitation ranged from 2.94 inches (75 mm) in February to 4.30 inches (109 mm) in March.[64] Cumberland has a humid subtropical climate (Cfa).
See also
References
- New Jersey County Map, New Jersey Department of State. Accessed July 10, 2017.
- QuickFacts - Cumberland County, New Jersey; New Jersey; United States, United States Census Bureau. Accessed March 24, 2018.
- Annual Estimates of the Resident Population: April 1, 2010 to July 1, 2018 - 2018 Population Estimates Archived February 13, 2020, at Archive.today, United States Census Bureau. Accessed March 24, 2018.
- GCT-PEPANNCHG: Estimates of Resident Population Change and Rankings: July 1, 2016 to July 1, 2017 - State -- County / County Equivalent from the 2017 Population Estimates for New Jersey Archived February 13, 2020, at Archive.today, United States Census Bureau. Accessed March 24, 2018.
- DP1 - Profile of General Population and Housing Characteristics: 2010 Demographic Profile Data for Cumberland County, New Jersey, United States Census Bureau. Accessed March 26, 2016.
- DP-1 - Profile of General Demographic Characteristics: 2000; Census 2000 Summary File 1 (SF 1) 100-Percent Data for Cumberland County, New Jersey, United States Census Bureau. Accessed January 21, 2013.
- NJ Labor Market Views Archived 2013-09-20 at the Wayback Machine, New Jersey Department of Labor and Workforce Development, March 15, 2011. Accessed October 3, 2013.
- New Jersey: 2010 - Population and Housing Unit Counts; 2010 Census of Population and Housing, p. 6, CPH-2-32. United States Census Bureau, August 2012. Accessed August 29, 2016.
- Baehr, Judy. "Cumberland – A County Born of Hope, Optimism" Archived 2007-12-16 at the Wayback Machine, Cumberland County, New Jersey. Accessed December 13, 2007. "The county was named for William Augustus, the second son of King George II. As the Duke of Cumberland in 1746, he had defeated the Stuart Pretender, Charles Edward (Bonnie Prince Charlie), at the battle of Culloden and established the House of Hanover on the British throne."
- The Origin of New Jersey Place Names: C, GetNJ.com. Accessed December 13, 2007.
- Snyder, John P. The Story of New Jersey's Civil Boundaries: 1606-1968, Bureau of Geology and Topography; Trenton, New Jersey; 1969. p. 78. Accessed September 30, 2013.
- May 2012 Metropolitan and Nonmetropolitan Area Definitions, Bureau of Labor Statistics. Accessed May 29, 2013.
- Revised Delineations of Metropolitan Statistical Areas, Micropolitan Statistical Areas, and Combined Statistical Areas, and Guidance on Uses of the Delineations of These Areas, Office of Management and Budget, February 28, 2013. Accessed October 3, 2013.
- Census 2010 U.S. Gazetteer Files: New Jersey Counties, United States Census Bureau, Backed up by the Internet Archive as of June 11, 2012. Accessed October 3, 2013.
- New Jersey County High Points, Peakbagger.com. Accessed October 3, 2013.
- "Population and Housing Unit Estimates". Retrieved June 25, 2019.
- Forstall, Richard L. Population of states and counties of the United States: 1790 to 1990 from the Twenty-one Decennial Censuses, pp. 108-109. United States Census Bureau, March 1996. ISBN 9780934213486. Accessed October 3, 2013.
- U.S. Census website , United States Census Bureau. Accessed September 4, 2014.
- Tables DP-1 to DP-4 from Census 2000 for Cumberland County, New Jersey, United States Census Bureau, backed up by the Internet Archive as of July 6, 2008. Accessed October 3, 2013.
- DP-2 - Profile of Selected Social Characteristics: 2000 from the Census 2000 Summary File 3 (SF 3) - Sample Data for Cumberland County, New Jersey, United States Census Bureau. Accessed September 30, 2013.
- DP-3 - Profile of Selected Economic Characteristics: 2000 from Census 2000 Summary File 3 (SF 3) - Sample Data for Cumberland County, New Jersey, United States Census Bureau. Accessed September 30, 2013.
- Local Area Gross Domestic Product, 2018, Bureau of Economic Analysis, released December 12, 2019. Accessed December 12, 2019.
- About Cumberland County Government, Cumberland County, New Jersey. Accessed June 7, 2018. "By law, Cumberland County is allowed 7 freeholders, who serve staggered, overlapping three year terms. Two are elected in two successive years, three in the third year, elected from the county at-large. A Director of the Board is selected by his colleagues for a one year term."
- Gallo Jr., Bill. "Which N.J. county freeholders are paid the most?", NJ.com, March 11, 2016. Accessed October 25, 2017. "Freeholder director: $16,000; Other freeholders: $15,000"
- The Cumberland County Board of Chosen Freeholders, Cumberland County, New Jersey. Accessed June 7, 2018.
- 2018 Directory of Cumberland County, New Jersey, Cumberland County, New Jersey. Accessed June 7, 2018.
- 2018 County Data Sheet, Cumberland County, New Jersey. Accessed June 7, 2018.
- General Election Results November 7, 2017, Official Results, Cumberland County, New Jersey, updated November 28, 2017. Accessed January 1, 2018.
- General Election Results November 8, 2016, Official Results, Cumberland County, New Jersey, updated November 18, 2016. Accessed June 7, 2018.
- Cumberland County GENERAL - November 3rd, 2015 Official Results, Cumberland County, New Jersey, updated November 3, 2015. Accessed June 7, 2018.
- Joseph Derella, Cumberland County, New Jersey. Accessed June 7, 2018.
- Darlene Barber, Cumberland County, New Jersey. Accessed June 7, 2018.
- George Castellini, Cumberland County, New Jersey. Accessed June 7, 2018.
- Carol Musso, Cumberland County, New Jersey. Accessed June 7, 2018.
- James F. Quinn, Cumberland County, New Jersey. Accessed June 7, 2018.
- Joseph V. Sparacio, Cumberland County, New Jersey. Accessed June 7, 2018.
- Jack Surrency, Cumberland County, New Jersey. Accessed June 7, 2018.
- Kent, Spencer. "Cumberland County Freeholder Director Bill Whelan resigns, seeking 'balance'", South Jersey Times, July 5, 2013. Accessed September 30, 2013. "Cumberland County Freeholder Director Bill Whelan announced his resignation Friday, effective immediately."
- Kent, Spencer. "Joe Derella named Cumberland County freeholder board's new director", South Jersey Times, July 23, 2013. Accessed September 24, 2013. "Joe Derella was chosen Tuesday night as the new director of the Cumberland County Board of Chosen Freeholders.... Democrat Carlos Mercado of Vineland was then sworn in to temporarily fill the board seat left empty by Whelan's departure."
- Smith, Joseph P. "Sexting scandal ends S.J. freeholder's career", Courier Post, August 3, 2011. Accessed August 3, 2011. "Louis N. Magazzu resigned from the board of freeholders Tuesday after a decade at the top of Democratic politics. His departure came after an embarrassing sexting scandal made the jump from a private website and local gossip circles into print and television media."
- New Jersey State Constitution (1947), Article VII, Section II, Paragraph 2, New Jersey Department of State. Accessed October 26, 2017.
- County Clerk: Celeste M. Riley, Cumberland County Clerk's Office. Accessed June 7, 2018.
- Members List: Clerks Archived 2017-10-23 at the Wayback Machine, Constitutional Officers Association of New Jersey. Accessed June 7, 2018.
- Sheriff's Office, Cumberland County, New Jersey. Accessed June 7, 2018.
- Members List: Sheriffs Archived 2017-10-23 at the Wayback Machine, Constitutional Officers Association of New Jersey. Accessed June 7, 2018.
- Cumberland County Surrogate Office, Cumberland County, New Jersey. Accessed June 7, 2018.
- Members List: Surrogates Archived 2017-10-23 at the Wayback Machine, Constitutional Officers Association of New Jersey. Accessed June 7, 2018.
- Jennifer Webb-McRae, Cumberland County Prosecutor's Office. Accessed October 25, 2017. "In January of 2010, Jennifer was nominated by Governor Jon S. Corzine to be the first African American, first female Prosecutor of Cumberland County.... In November of 2016, Governor Chris Christie nominated Prosecutor Webb-McRae for a second five year term as Cumberland County Prosecutor. In January of 2017, Prosecutor Webb-McRae was sworn in becoming the first full-time Prosecutor in Cumberland County to serve a second term."
- "Governor Chris Christie Files Nominations And Direct Appointments", Governor of New Jersey Chris Christie, press release dated November 21, 2016. Accessed October 25, 2017. "Cumberland County Prosecutor - Nominate for reappointment Jennifer Webb-McRae (Vineland, Cumberland)"
- Cumberland/Gloucester/Salem Counties, New Jersey Courts. Accessed October 23, 2017.
- 2012 Congressional Districts by County, New Jersey Department of State Division of Elections. Accessed October 3, 2013.
- Plan Components Report, New Jersey Department of State Division of Elections, December 23, 2011. Accessed October 3, 2013.
- Directory of Representatives: New Jersey, United States House of Representatives. Accessed January 3, 2019.
- 2011 Legislative Districts by County, New Jersey Department of State Division of Elections. Accessed October 3, 2013.
- Legislative Roster 2020–2021 Session, New Jersey Legislature. Accessed April 16, 2020.
- District 1 Legislators, New Jersey Legislature. Accessed April 16, 2020.
- Legislative Roster 2018-2019 Session, New Jersey Legislature. Accessed January 21, 2018.
- District 3 Legislators, New Jersey Legislature. Accessed January 22, 2018.
- Jackson, Miles. "Is A New Prison Needed?: Facilities offer steady employment in Cumberland Co.", Daily Journal. June 23, 2007. A1 News. Accessed September 27, 2011. "The county already is home to South Woods State Prison in Bridgeton, Southern State Correctional Facility in Delmont and Bayside State Prison in Leesburg."
- New Jersey Presidential Election Returns by County 2004 Archived 2008-09-14 at the Wayback Machine, Eagleton Institute of Politics at Rutgers University. Accessed August 31, 2008.
- Leip, David. "Dave Leip's Atlas of U.S. Presidential Elections". uselectionatlas.org. Retrieved 2018-06-09.
- GCT-PH1: Population, Housing Units, Area, and Density: 2010 - County -- County Subdivision and Place from the 2010 Census Summary File 1 for Cumberland County, New Jersey, United States Census Bureau. Accessed October 23, 2017.
- Cumberland County Mileage by Municipality and Jurisdiction, New Jersey Department of Transportation, May 2010. Accessed July 18, 2014.
- "Monthly Averages for Bridgeton, New Jersey". The Weather Channel. Retrieved October 13, 2012.
External links

- Official website
Places adjacent to Cumberland County, New Jersey | ||||||||||
|---|---|---|---|---|---|---|---|---|---|---|
| ||||||||||
Municipalities and communities of Cumberland County, New Jersey, United States | ||
|---|---|---|
| Cities | Map of New Jersey highlighting Cumberland County | |
| Borough | ||
| Townships | ||
| CDPs | ||
| Other unincorporated communities | ||
| Counties |  | |
|---|---|---|
| Major cities | ||
| Cities and towns 50k-99k | ||
| Cities and towns 30k-50k | ||
| Authority control |
|
|---|