Risk aversion
In economics and finance, risk aversion is the behavior of humans (especially consumers and investors), who, when exposed to uncertainty, attempt to lower that uncertainty. It is the hesitation of a person to agree to a situation with an unknown payoff rather than another situation with a more predictable payoff but possibly lower expected payoff. For example, a risk-averse investor might choose to put their money into a bank account with a low but guaranteed interest rate, rather than into a stock that may have high expected returns, but also involves a chance of losing value.

Example


A person is given the choice between two scenarios, one with a guaranteed payoff and one without. In the guaranteed scenario, the person receives $50. In the uncertain scenario, a coin is flipped to decide whether the person receives $100 or nothing. The expected payoff for both scenarios is $50, meaning that an individual who was insensitive to risk would not care whether they took the guaranteed payment or the gamble. However, individuals may have different risk attitudes.[1][2][3]
A person is said to be:
- risk averse (or risk avoiding) - if they would accept a certain payment (certainty equivalent) of less than $50 (for example, $40), rather than taking the gamble and possibly receiving nothing.
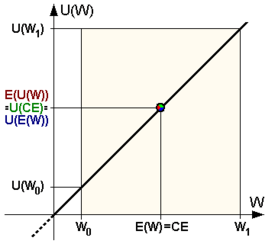
- risk neutral – if they are indifferent between the bet and a certain $50 payment.
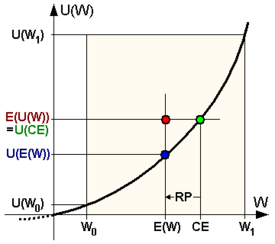
- risk loving (or risk seeking) – if they would accept the bet even when the guaranteed payment is more than $50 (for example, $60).
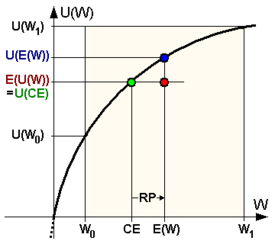
The average payoff of the gamble, known as its expected value, is $50. The smallest dollar amount that the individual would accept instead of the bet is called the certainty equivalent, and the difference between the expected value and the certainty equivalent is called the risk premium. For risk-averse individuals, it is positive, for risk-neutral persons it is zero, and for risk-loving individuals their risk premium is negative.
Utility of money
In expected utility theory, an agent has a utility function u(c) where c represents the value that he might receive in money or goods (in the above example c could be $0 or $40 or $100).
The utility function u(c) is defined only up to positive affine transformation – in other words, a constant could be added to the value of u(c) for all c, and/or u(c) could be multiplied by a positive constant factor, without affecting the conclusions.
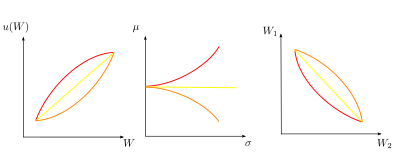
An agent possesses risk aversion if and only if the utility function is concave. For instance u(0) could be 0, u(100) might be 10, u(40) might be 5, and for comparison u(50) might be 6.
The expected utility of the above bet (with a 50% chance of receiving 100 and a 50% chance of receiving 0) is
- ,
and if the person has the utility function with u(0)=0, u(40)=5, and u(100)=10 then the expected utility of the bet equals 5, which is the same as the known utility of the amount 40. Hence the certainty equivalent is 40.
The risk premium is ($50 minus $40)=$10, or in proportional terms
or 25% (where $50 is the expected value of the risky bet: (). This risk premium means that the person would be willing to sacrifice as much as $10 in expected value in order to achieve perfect certainty about how much money will be received. In other words, the person would be indifferent between the bet and a guarantee of $40, and would prefer anything over $40 to the bet.
In the case of a wealthier individual, the risk of losing $100 would be less significant, and for such small amounts his utility function would be likely to be almost linear, for instance if u(0) = 0 and u(100) = 10, then u(40) might be 4.0001 and u(50) might be 5.0001.
The utility function for perceived gains has two key properties: an upward slope, and concavity. (i) The upward slope implies that the person feels that more is better: a larger amount received yields greater utility, and for risky bets the person would prefer a bet which is first-order stochastically dominant over an alternative bet (that is, if the probability mass of the second bet is pushed to the right to form the first bet, then the first bet is preferred). (ii) The concavity of the utility function implies that the person is risk averse: a sure amount would always be preferred over a risky bet having the same expected value; moreover, for risky bets the person would prefer a bet which is a mean-preserving contraction of an alternative bet (that is, if some of the probability mass of the first bet is spread out without altering the mean to form the second bet, then the first bet is preferred).
Measures of risk aversion under expected utility theory
There are multiple measures of the risk aversion expressed by a given utility function. Several functional forms often used for utility functions are expressed in terms of these measures.
Absolute risk aversion
The higher the curvature of , the higher the risk aversion. However, since expected utility functions are not uniquely defined (are defined only up to affine transformations), a measure that stays constant with respect to these transformations is needed. One such measure is the Arrow–Pratt measure of absolute risk aversion (ARA), after the economists Kenneth Arrow and John W. Pratt,[4][5] also known as the coefficient of absolute risk aversion, defined as
where and denote the first and second derivatives with respect to of .
The following expressions relate to this term:
- Exponential utility of the form is unique in exhibiting constant absolute risk aversion (CARA): is constant with respect to c.
- Hyperbolic absolute risk aversion (HARA) is the most general class of utility functions that are usually used in practice (specifically, CRRA (constant relative risk aversion, see below), CARA (constant absolute risk aversion), and quadratic utility all exhibit HARA and are often used because of their mathematical tractability). A utility function exhibits HARA if its absolute risk aversion is a hyperbolic function, namely
The solution to this differential equation (omitting additive and multiplicative constant terms, which do not affect the behavior implied by the utility function) is:
where and . Note that when , this is CARA, as , and when , this is CRRA (see below), as . See [6]
- Decreasing/increasing absolute risk aversion (DARA/IARA) is present if is decreasing/increasing. Using the above definition of ARA, the following inequality holds for DARA:
and this can hold only if . Therefore, DARA implies that the utility function is positively skewed; that is, .[7] Analogously, IARA can be derived with the opposite directions of inequalities, which permits but does not require a negatively skewed utility function (). An example of a DARA utility function is , with , while , with would represent a quadratic utility function exhibiting IARA.
- Experimental and empirical evidence is mostly consistent with decreasing absolute risk aversion.[8]
- Contrary to what several empirical studies have assumed, wealth is not a good proxy for risk aversion when studying risk sharing in a principal-agent setting. Although is monotonic in wealth under either DARA or IARA and constant in wealth under CARA, tests of contractual risk sharing relying on wealth as a proxy for absolute risk aversion are usually not identified.[9]
Relative risk aversion
The Arrow–Pratt measure of relative risk aversion (RRA) or coefficient of relative risk aversion is defined as[10]
- .
Unlike ARA whose units are in $−1, RRA is a dimension-less quantity, which allows it to be applied universally. Like for absolute risk aversion, the corresponding terms constant relative risk aversion (CRRA) and decreasing/increasing relative risk aversion (DRRA/IRRA) are used. This measure has the advantage that it is still a valid measure of risk aversion, even if the utility function changes from risk averse to risk loving as c varies, i.e. utility is not strictly convex/concave over all c. A constant RRA implies a decreasing ARA, but the reverse is not always true. As a specific example of constant relative risk aversion, the utility function implies RRA = 1.
In intertemporal choice problems, the elasticity of intertemporal substitution often cannot be disentangled from the coefficient of relative risk aversion. The isoelastic utility function
exhibits constant relative risk aversion with and the elasticity of intertemporal substitution . When using l'Hôpital's rule shows that this simplifies to the case of log utility, u(c) = log c, and the income effect and substitution effect on saving exactly offset.
A time-varying relative risk aversion can be considered.[11]
Implications of increasing/decreasing absolute and relative risk aversion
The most straightforward implications of increasing or decreasing absolute or relative risk aversion, and the ones that motivate a focus on these concepts, occur in the context of forming a portfolio with one risky asset and one risk-free asset.[4][5] If the person experiences an increase in wealth, he/she will choose to increase (or keep unchanged, or decrease) the number of dollars of the risky asset held in the portfolio if absolute risk aversion is decreasing (or constant, or increasing). Thus economists avoid using utility functions such as the quadratic, which exhibit increasing absolute risk aversion, because they have an unrealistic behavioral implication.
Similarly, if the person experiences an increase in wealth, he/she will choose to increase (or keep unchanged, or decrease) the fraction of the portfolio held in the risky asset if relative risk aversion is decreasing (or constant, or increasing).
In one model in monetary economics, an increase in relative risk aversion increases the impact of households' money holdings on the overall economy. In other words, the more the relative risk aversion increases, the more money demand shocks will impact the economy.[12]
Portfolio theory
In modern portfolio theory, risk aversion is measured as the additional expected reward an investor requires to accept additional risk. Here risk is measured as the standard deviation of the return on investment, i.e. the square root of its variance. In advanced portfolio theory, different kinds of risk are taken into consideration. They are measured as the n-th root of the n-th central moment. The symbol used for risk aversion is A or An.
Limitations of expected utility treatment of risk aversion
The notion of using expected utility theory's approach to risk aversion to analyze small stakes decisions has come under criticism from behavioral economics. Matthew Rabin has showed that a risk-averse, expected-utility-maximizing individual who,
from any initial wealth level [...] turns down gambles where she loses $100 or gains $110, each with 50% probability [...] will turn down 50–50 bets of losing $1,000 or gaining any sum of money.[13]
Rabin criticizes this implication of expected utility theory on grounds of implausibility—individuals who are risk averse for small gambles due to diminishing marginal utility would exhibit extreme forms of risk aversion in risky decisions under larger stakes. One solution to the problem observed by Rabin is that proposed by prospect theory and cumulative prospect theory, where outcomes are considered relative to a reference point (usually the status quo), rather than to consider only the final wealth.
Another limitation is the reflection effect which demonstrates the reversing of risk aversion. This effect was first presented by Kahneman and Tversky as a part of the prospect theory, in the behavioral economics domain. The reflection effect is an identified pattern of opposite preferences between negative prospects as opposed to positive prospects. According to this effect, people tend to avoid risks under the gain domain, and to seek risks under the loss domain. Meaning, no risk aversion is expected under the loss domain.[14] For example, in the gain domain, most people prefer a certain gain of 3000, than a gain of 4000 with a risk of 80 percent. When posing the same problem under the loss domain - with negative values, most people prefer a loss of 4000 with 80 percent chance, over a certain loss of 3000.
The reflection effect (as well as the certainty effect) is inconsistent with the expected utility hypothesis. It is assumed that the psychological principle which stands behind this kind of behavior is the overweighting of certainty. Meaning, options which are perceived as certain, are over-weighted relative to uncertain options. This pattern is an indication of a risk seeking behavior in negative prospects and eliminates other explanations for the certainty effect such as aversion for uncertainty or variability.[14]
The initial findings regarding the reflection effect faced criticism regarding its validity, as it was claimed that there are insufficient evidence to support the effect on the individual level. Subsequently, an extensive investigation revealed its possible limitations, suggesting that the effect is most prevalent when either small or large amounts and extreme probabilities are involved.[15][16]
In the brain
Attitudes towards risk have attracted the interest of the field of neuroeconomics and behavioral economics. A 2009 study by Christopoulos et al. suggested that the activity of a specific brain area (right inferior frontal gyrus) correlates with risk aversion, with more risk averse participants (i.e. those having higher risk premia) also having higher responses to safer options.[17] This result coincides with other studies,[18][19] that show that neuromodulation of the same area results in participants making more or less risk averse choices, depending on whether the modulation increases or decreases the activity of the target area.
Public understanding and risk in social activities
In the real world, many government agencies, e.g. Health and Safety Executive, are fundamentally risk-averse in their mandate. This often means that they demand (with the power of legal enforcement) that risks be minimized, even at the cost of losing the utility of the risky activity. It is important to consider the opportunity cost when mitigating a risk; the cost of not taking the risky action. Writing laws focused on the risk without the balance of the utility may misrepresent society's goals. The public understanding of risk, which influences political decisions, is an area which has recently been recognised as deserving focus. In 2007 Cambridge University initiated the Winton Professorship of the Public Understanding of Risk, a role described as outreach rather than traditional academic research by the holder, David Spiegelhalter.[20]
Children
Children's services such as schools and playgrounds have become the focus of much risk-averse planning, meaning that children are often prevented from benefiting from activities that they would otherwise have had. Many playgrounds have been fitted with impact-absorbing matting surfaces. However, these are only designed to save children from death in the case of direct falls on their heads and do not achieve their main goals.[21] They are expensive, meaning that less resources are available to benefit users in other ways (such as building a playground closer to the child's home, reducing the risk of a road traffic accident on the way to it), and—some argue—children may attempt more dangerous acts, with confidence in the artificial surface. Shiela Sage, an early years school advisor, observes "Children who are only ever kept in very safe places, are not the ones who are able to solve problems for themselves. Children need to have a certain amount of risk taking ... so they'll know how to get out of situations."[22]
Mobile phones
Mobile phones may carry some small[23][24] health risk. While most people would accept that unproven risk to gain the benefit of improved communication, others remain so risk averse that they do not. (The COSMOS cohort study continues to study the actual risks of mobile phones.)
Game shows and investments
One experimental study with student-subject playing the game of the TV show Deal or No Deal finds that people are more risk averse in the limelight than in the anonymity of a typical behavioral laboratory. In the laboratory treatments, subjects made decisions in a standard, computerized laboratory setting as typically employed in behavioral experiments. In the limelight treatments, subjects made their choices in a simulated game show environment, which included a live audience, a game show host, and video cameras.[25] In line with this, studies on investor behavior find that investors trade more and more speculatively after switching from phone-based to online trading[26][27] and that investors tend to keep their core investments with traditional brokers and use a small fraction of their wealth to speculate online.[28]
See also
- Ambiguity aversion
- Equity premium puzzle
- Investor profile
- Loss aversion
- Marginal utility
- Neuroeconomics
- Optimism bias
- Problem gambling, a contrary behavior
- Prudence in economics and finance
- Risk premium
- St. Petersburg paradox
- Statistical risk
- Uncertainty avoidance, which is different, as uncertainty is not the same as risk
- Utility
References
- Mr Lev Virine; Mr Michael Trumper (28 October 2013). ProjectThink: Why Good Managers Make Poor Project Choices. Gower Publishing, Ltd. ISBN 978-1-4724-0403-9.
- David Hillson; Ruth Murray-Webster (2007). Understanding and Managing Risk Attitude. Gower Publishing, Ltd. ISBN 978-0-566-08798-1.
- Adhikari, Binay K; Agrawal, Anup (2016). "Does local religiosity matter for bank risk-taking?". Journal of Corporate Finance. 38: 272–293. doi:10.1016/j.jcorpfin.2016.01.009.
- Arrow, K. J. (1965). "Aspects of the Theory of Risk Bearing". The Theory of Risk Aversion. Helsinki: Yrjo Jahnssonin Saatio. Reprinted in: Essays in the Theory of Risk Bearing, Markham Publ. Co., Chicago, 1971, 90–109.
- Pratt, J. W. (1964). "Risk Aversion in the Small and in the Large". Econometrica. 32 (1–2): 122–136. doi:10.2307/1913738. JSTOR 1913738.
- "Zender's lecture notes".
- Levy, Haim (2006). Stochastic Dominance: Investment Decision Making under Uncertainty (Second ed.). New York: Springer. ISBN 978-0-387-29302-8.
- Friend, Irwin; Blume, Marshall (1975). "The Demand for Risky Assets". American Economic Review. 65 (5): 900–922. JSTOR 1806628.
- Bellemare, Marc F.; Brown, Zachary S. (2010). "On the (Mis)Use of Wealth as a Proxy for Risk Aversion" (PDF). American Journal of Agricultural Economics. 92 (1): 273–282. doi:10.1093/ajae/aap006. hdl:10161/7006.
- Simon, Carl and Lawrence Blume. Mathematics for Economists (Student ed.). Viva Norton. p. 363. ISBN 978-81-309-1600-2.
- Benchimol, J. (2014). "Risk aversion in the Eurozone". Research in Economics. 68 (1): 39–56. doi:10.1016/j.rie.2013.11.005.
- Benchimol, J., Fourçans, A. (2012), Money and risk in a DSGE framework : A Bayesian application to the Eurozone, Journal of Macroeconomics, vol. 34, pp. 95–111.
- Rabin, Matthew (2000). "Risk Aversion and Expected-Utility Theory: A Calibration Theorem". Econometrica. 68 (5): 1281–1292. CiteSeerX 10.1.1.295.4269. doi:10.1111/1468-0262.00158.
- Kahneman, Daniel; Tversky, Amos (1979). "Prospect theory: An analysis of decision under risk". Econometrica. 47 (2): 263–291. CiteSeerX 10.1.1.407.1910. doi:10.2307/1914185. JSTOR 1914185.
- Hershey, J. C.; Schoemaker, P. J. (1980). "Prospect theory's reflection hypothesis: A critical examination". Organizational Behavior and Human Performance. 25 (3): 395–418. doi:10.1016/0030-5073(80)90037-9.
- Battalio, R. C.; Kagel, J. H.; Jiranyakul, K (1990). "Testing between alternative models of choice under uncertainty: Some initial results". Journal of Risk and Uncertainty. 3 (1): 25–50. doi:10.1007/BF00213259.
- Christopoulos GI, Tobler PN, Bossaerts P, Dolan RJ, Schultz W (2009). "Neural Correlates of Value, Risk, and Risk Aversion Contributing to Decision Making under Risk". J Neurosci. 26 (24): 6469–6472. doi:10.1523/JNEUROSCI.0804-06.2006. PMC 6674035. PMID 16775134.
- Knoch D, Gianotti LR, Pascual-Leone A, Treyer V, Regard M, Hohmann M, Brugger P; Gianotti; Pascual-Leone; Treyer; Regard; Hohmann; Brugger (2006). "Disruption of right prefrontal cortex by low-frequency repetitive transcranial magnetic stimulation induces risk-taking behavior" (PDF). J Neurosci. 26 (24): 6469–6472. doi:10.1523/JNEUROSCI.0804-06.2006. PMID 16775134.CS1 maint: multiple names: authors list (link)
- Fecteau S, Pascual-Leone A, Zald DH, Liguori P, Théoret H, Boggio PS, Fregni F; Pascual-Leone; Zald; Liguori; Théoret; Boggio; Fregni (2007). "Activation of prefrontal cortex by transcranial direct current stimulation reduces appetite for risk during ambiguous decision making". J Neurosci. 27 (23): 6212–6218. doi:10.1523/JNEUROSCI.0314-07.2007. PMC 6672163. PMID 17553993.CS1 maint: multiple names: authors list (link)
- Spiegelhalter, David (2009). "Don's Diary" (PDF). CAM – the Cambridge Alumni Magazine. The University of Cambridge Development Office. 58: 3. Archived from the original (PDF) on March 9, 2013.
- Gill, Tim (2007). No fear: Growing up in a Risk Averse society (PDF). Calouste Gulbenkian Foundation. p. 81. ISBN 9781903080085. Archived from the original (PDF) on 2009-03-06.
- Sue Durant, Sheila Sage (10 January 2006). Early Years – The Outdoor Environment. Teachers TV.
- "What are the health risks associated with mobile phones and their base stations?". Online Q&A. World Health Organization. 2005-12-05. Retrieved 2008-01-19.
- "Electromagnetic fields and public health: mobile telephones and their base stations". Fact sheet N°193. World Health Organization. June 2000. Retrieved 2008-01-19.
- Baltussen, Guido; van den Assem, Martijn; van Dolder, Dennie (October 2014). "Risky Choice in the Limelight". Review of Economics and Statistics. SSRN 2057134.
- Barber, Brad; Odean, Terrance (2001). "The Internet and the Investor". Journal of Economic Perspectives. 15 (1): 41–54. doi:10.1257/jep.15.1.41.
- Barber, Brad; Odean, Terrance (2002). "Online Investors: Do the Slow Die First?". Review of Financial Studies. 15 (2): 455–488. CiteSeerX 10.1.1.46.6569. doi:10.1093/rfs/15.2.455.
- Konana, Prabhudev; Balasubramanian, Sridhar (2005). "The Social–Economic–Psychological model of technology adoption and usage: an application to online investing". Decision Support Systems. 39 (3): 505–524. doi:10.1016/j.dss.2003.12.003.
External links
- Closed form solution for a consumption savings problem with CARA utility
- Paper about problems with risk aversion
- Economist article on monkey experiments showing behaviours resembling risk aversion (requires a paid subscription to economist.com)
- Arrow-Pratt Measure on About.com:Economics
- Risk Aversion of Individuals vs Risk Aversion of the Whole Economy
- The benefit of utilities: a plausible explanation for small risky parts in the portfolio