Bailey County, Texas
Bailey County is a county located in the U.S. state of Texas. As of the 2010 census, the population was 7,165.[1] This county is east from the New Mexico state line. Its county seat is Muleshoe.[2] The county was created in 1876 and later organized in 1919.[3] It is named for Peter James Bailey, a defender of the Alamo. (See List of Texas county name etymologies.)
Bailey County | |
|---|---|
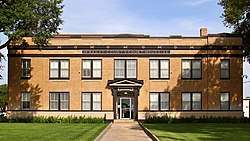
 The Bailey County Courthouse in Muleshoe | |
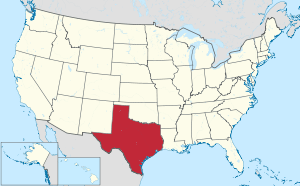
 Location within the U.S. state of Texas | |
 Texas's location within the U.S. | |
| Coordinates: 34°04′N 102°50′W | |
| Country | |
| State | |
| Founded | 1919 |
| Named for | Peter James Bailey |
| Seat | Muleshoe |
| Largest city | Muleshoe |
| Area | |
| • Total | 827 sq mi (2,140 km2) |
| • Land | 827 sq mi (2,140 km2) |
| • Water | 0.7 sq mi (2 km2) 0.08%% |
| Population (2010) | |
| • Total | 7,165 |
| • Density | 8.7/sq mi (3.4/km2) |
| Time zone | UTC−6 (Central) |
| • Summer (DST) | UTC−5 (CDT) |
| Congressional district | 19th |
| Website | www |
Bailey County was one of 30[4] prohibition or entirely dry counties in the state of Texas, but is now a wet county.
Bailey County history is highlighted in the Muleshoe Heritage Center located off U.S. Highways 70 and 64 in Muleshoe. The Muleshoe National Wildlife Refuge, located in the county, was founded in 1935 and is the oldest such refuge in Texas.
Geography
According to the U.S. Census Bureau, the county has a total area of 827 square miles (2,140 km2), of which 827 square miles (2,140 km2) are land and 0.7 square miles (1.8 km2) (0.08%) is covered by water.[5]
Major highways


Adjacent counties
- Parmer County (north)
- Lamb County (east)
- Cochran County (south)
- Roosevelt County, New Mexico (west/Mountain Time Zone)
- Curry County, New Mexico (northwest/Mountain Time Zone)
National protected areas
Demographics
| Historical population | |||
|---|---|---|---|
| Census | Pop. | %± | |
| 1900 | 4 | — | |
| 1910 | 312 | 7,700.0% | |
| 1920 | 517 | 65.7% | |
| 1930 | 5,186 | 903.1% | |
| 1940 | 6,318 | 21.8% | |
| 1950 | 7,592 | 20.2% | |
| 1960 | 9,090 | 19.7% | |
| 1970 | 8,487 | −6.6% | |
| 1980 | 8,168 | −3.8% | |
| 1990 | 7,064 | −13.5% | |
| 2000 | 6,594 | −6.7% | |
| 2010 | 7,165 | 8.7% | |
| Est. 2019 | 7,000 | [6] | −2.3% |
| U.S. Decennial Census[7] 1850–2010[8] 2010–2014[1] | |||
As of the 2010 United States Census, 7,165 people lived in the county. About 75.3% were White, 1.4% Native American, 1.2% Black or African American, 0.4% Asian, 0.1% Pacific Islander, 19.6% of some other race, and 2.0% of two or more races; 59.8% were Hispanics or Latinos (of any race).
As of the census[9] of 2000, 6,594 people, 2,348 households, and 1,777 families lived in the county. The population density was eight people per square mile (3/km²). The 2,738 housing units averaged three per square mile (1/km²). The racial makeup of the county was 66.68% White, 1.27% Black or African American, 0.65% Native American, 0.14% Asian, 28.60% from other races, and 2.65% from two or more races; 47.30% of the population were Hispanic or Latino of any race.
Of the 2,348 households, 37.1% had children under the age of 18 living with them, 64.9% were married couples living together, 7.5% had a female householder with no husband present, and 24.3% were not families. About 22.3% of all households were made up of individuals and 12.8% had someone living alone who was 65 years of age or older. The average household size was 2.78 and the average family size was 3.28.
In the county, the population was distributed as 30.3% under the age of 18, 8.6% from 18 to 24, 24.7% from 25 to 44, 21.2% from 45 to 64, and 15.2% who were 65 years of age or older. The median age was 35 years. For every 100 females, there were 96.0 males. For every 100 females age 18 and over, there were 94.1 males.
The median income for a household in the county was $27,901, and for a family was $32,898. Males had a median income of $25,150 versus $18,309 for females. The per capita income for the county was $12,979. About 13.50% of families and 16.70% of the population were below the poverty line, including 20.40% of those under age 18 and 12.60% of those age 65 or over.
Education
Most of Bailey County is served by the Muleshoe Independent School District, which extends into neighboring counties.
Farwell Independent School District and Sudan Independent School District, which are based in nearby counties, extend into Bailey County and serve small portions of it.
Politics
| Year | Republican | Democratic | Third parties |
|---|---|---|---|
| 2016 | 75.0% 1,344 | 22.1% 397 | 2.9% 52 |
| 2012 | 73.7% 1,339 | 25.7% 466 | 0.6% 11 |
| 2008 | 69.9% 1,618 | 29.5% 682 | 0.7% 16 |
| 2004 | 78.0% 1,882 | 21.8% 525 | 0.2% 5 |
| 2000 | 76.0% 1,589 | 23.4% 488 | 0.6% 13 |
| 1996 | 60.3% 1,246 | 34.2% 706 | 5.5% 114 |
| 1992 | 55.3% 1,308 | 28.6% 677 | 16.1% 380 |
| 1988 | 62.3% 1,459 | 37.4% 876 | 0.3% 8 |
| 1984 | 73.0% 1,888 | 26.5% 684 | 0.5% 14 |
| 1980 | 68.1% 1,809 | 30.1% 800 | 1.7% 46 |
| 1976 | 47.8% 1,255 | 51.6% 1,356 | 0.6% 16 |
| 1972 | 79.7% 1,837 | 20.2% 465 | 0.1% 3 |
| 1968 | 45.9% 1,174 | 32.1% 820 | 22.1% 564 |
| 1964 | 41.2% 1,056 | 58.7% 1,503 | 0.1% 3 |
| 1960 | 52.0% 1,180 | 46.9% 1,064 | 1.2% 27 |
| 1956 | 40.5% 871 | 59.2% 1,274 | 0.3% 6 |
| 1952 | 51.7% 1,118 | 48.1% 1,039 | 0.2% 5 |
| 1948 | 16.1% 234 | 76.8% 1,115 | 7.1% 103 |
| 1944 | 24.6% 358 | 64.7% 943 | 10.8% 157 |
| 1940 | 23.6% 330 | 76.3% 1,066 | 0.1% 1 |
| 1936 | 19.2% 191 | 79.4% 788 | 1.4% 14 |
| 1932 | 10.9% 104 | 88.8% 851 | 0.3% 3 |
| 1928 | 74.3% 410 | 25.7% 142 | |
| 1924 | 25.2% 63 | 66.4% 166 | 8.4% 21 |
See also
- Dry counties
- Recorded Texas Historic Landmarks in Bailey County
References
- "State & County QuickFacts". United States Census Bureau. Archived from the original on January 6, 2016. Retrieved December 8, 2013.
- "Find a County". National Association of Counties. Archived from the original on 2011-05-31. Retrieved 2011-06-07.
- "Texas: Individual County Chronologies". Texas Atlas of Historical County Boundaries. The Newberry Library. 2008. Retrieved May 20, 2015.
- "TABC Local Option Elections General Information". Tabc.state.tx.us. Retrieved 2018-07-29.
- "2010 Census Gazetteer Files". United States Census Bureau. August 22, 2012. Retrieved April 19, 2015.
- "Population and Housing Unit Estimates". United States Census Bureau. May 24, 2020. Retrieved May 27, 2020.
- "U.S. Decennial Census". United States Census Bureau. Retrieved April 19, 2015.
- "Texas Almanac: Population History of Counties from 1850–2010" (PDF). Texas Almanac. Retrieved April 19, 2015.
- "U.S. Census website". United States Census Bureau. Retrieved 2011-05-14.
- Leip, David. "Dave Leip's Atlas of U.S. Presidential Elections". uselectionatlas.org. Retrieved 2018-07-19.
External links
| Wikimedia Commons has media related to Bailey County, Texas. |
- Official website
- Bailey County, Texas from the Handbook of Texas Online
- Bailey County from the Texas Almanac
- Bailey County from the TXGenWeb Project
- Bailey County Profile from the Texas Association of Counties
