1960 United States presidential election in Illinois
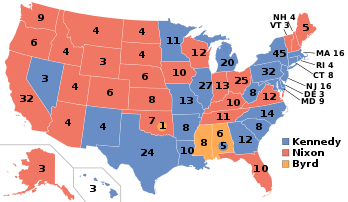
The 1960 United States presidential election in Illinois took place on November 8, 1960, as part of the 1960 United States presidential election. State voters chose twenty-seven[2] representatives, or electors, to the Electoral College, who voted for president and vice president.
| ||||||||||||||||||||||||||
| Turnout | 86.51% | |||||||||||||||||||||||||
|---|---|---|---|---|---|---|---|---|---|---|---|---|---|---|---|---|---|---|---|---|---|---|---|---|---|---|
| ||||||||||||||||||||||||||
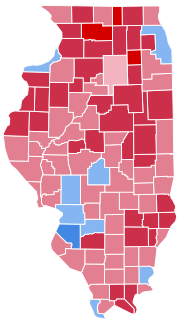 County Results
| ||||||||||||||||||||||||||
| ||||||||||||||||||||||||||
| Elections in Illinois | ||||||||||
|---|---|---|---|---|---|---|---|---|---|---|
 | ||||||||||
|
||||||||||
|
||||||||||
|
||||||||||
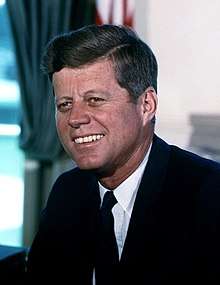
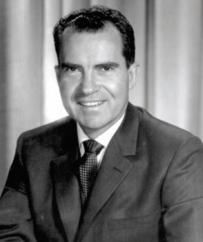
In the nation's second-closest race following Hawaii, Illinois was won by Senator John F. Kennedy (D–Massachusetts), running with Senator Lyndon B. Johnson, with 49.98% of the popular vote against incumbent Vice President Richard Nixon (R–California), running with United States Ambassador to the United Nations Henry Cabot Lodge, Jr., with 49.80% of the popular vote, a margin of victory of only 0.18%.[3][4]. As of 2016, this is the last time Illinois did not vote for the same candidate as California.
Election information
The primaries and general elections coincided with those for other federal offices (Senate and House), as well as those for state offices.[5]
Primaries
Both major parties held non-binding state-run preferential primaries on April 12.[5][8]
Democratic
| ||||||||||||||||||||||||||||||||||||||||
| ||||||||||||||||||||||||||||||||||||||||
The 1960 Illinois Democratic presidential primary was held on April 12, 1960 in the U.S. state of Illinois as one of the Democratic Party's state primaries ahead of the 1960 presidential election.
The popular vote was a non-binding "beauty contest".[9] Delegates were instead elected by direct votes by congressional district on delegate candidates.[8][10]
All candidates were write-ins. Kennedy ran a write-in campaign, and no candidate actively ran against him in Illinois.[9]
Not all of the vote-getters had been declared candidates. Johnson, Stevenson, and Symington had all sat out the primaries.
Chicago mayor Richard J. Daley, head of the Cook County Democratic Party, promised to deliver Kennedy the support of Cook County's delegates, so long as Kennedy won competitive primaries in other states.[9]
| 1960 Illinois Democratic presidential primary[5][8][11] | ||||||
|---|---|---|---|---|---|---|
| Candidate | Votes | Percentage | ||||
| John F. Kennedy (write-in) | 34,332 | 64.57% | ||||
| Adlai Stevenson (write-in) | 8,029 | 15.10% | ||||
| Stuart Symington (write-in) | 5,744 | 10.80% | ||||
| Hubert Humphrey (write-in) | 4,283 | 8.06% | ||||
| Lyndon B. Johnson (write-in) | 442 | 0.83% | ||||
| Others | 337 | 0.63% | ||||
| Totals | 53,167 | 100.00% | ||||
Republican
| ||||||||||||||||
| ||||||||||||||||
The 1960 Illinois Republican presidential primary was held on April 12, 1960 in the U.S. state of Illinois as one of the Republican Party's state primaries ahead of the 1960 presidential election.
The preference vote was a "beauty contest". Delegates were instead selected by direct-vote in each congressional districts on delegate candidates.[8][10]
Nixon ran unopposed in the primary.
| 1960 Illinois Republican presidential primary[5][8][11] | ||||||
|---|---|---|---|---|---|---|
| Party | Candidate | Votes | Percentage | |||
| Republican | Richard Nixon | 782,849 | 99.94% | |||
| Write-in | Others | 442 | 0.1% | |||
| Totals | 783,291 | 100.00% | ||||
Controversy
Some, including Republican legislators and journalists, believed that Kennedy benefited from vote fraud from Mayor Richard Daley's powerful Chicago political machine.[12] Republicans tried and failed to overturn the results at the time—as well as in ten other states.[13] Some journalists also later claimed that mobster Sam Giancana and his Chicago crime syndicate "played a role" in Kennedy's victory.[13] Nixon's campaign staff urged him to pursue recounts and challenge the validity of Kennedy's victory, however, Nixon gave a speech three days after the election stating that he would not contest the election.[14]
A myth arose that Chicago Mayor Richard J. Daley held back much of the city's vote until the late morning hours of November 9. Yet when the Republican Chicago Tribune went to press, 79% of Cook County precincts had reported, compared with just 62% of Illinois's precincts overall. Moreover, Nixon never led in Illinois, and Kennedy's lead merely shrank as election night went on.[15] Earl Mazo, a reporter for the pro-Nixon New York Herald Tribune and his biographer, investigated the voting in Chicago and "claimed to have discovered sufficient evidence of vote fraud to prove that the state was stolen for Kennedy."[12]
However, a special prosecutor assigned to the case brought charges against 650 people, which did not result in convictions.[14] Three Chicago election workers were convicted of voter fraud in 1962 and served short terms in jail.[14] Mazo, the Herald-Tribune reporter, later said that he "found names of the dead who had voted in Chicago, along with 56 people from one house."[14] He found cases of Republican voter fraud in southern Illinois, but said that the totals "did not match the Chicago fraud he found."[14]
Results
| Party | Candidate | Votes | % | |
|---|---|---|---|---|
| Democratic | John F. Kennedy | 2,377,846 | 49.98% | |
| Republican | Richard Nixon | 2,368,988 | 49.80% | |
| Socialist Labor | Eric Hass | 10,560 | 0.22% | |
| Write-in | 15 | 0.00% | ||
| Total votes | 4,757,409 | 100% | ||
Results by county
| County | John Fitzgerald Kennedy Democratic |
Richard Milhous Nixon Republican |
Various candidates Other parties |
Margin | Total votes cast[16] | ||||
|---|---|---|---|---|---|---|---|---|---|
| # | % | # | % | # | % | # | % | ||
| Adams | 14,827 | 44.22% | 18,674 | 55.70% | 28 | 0.08% | -3,847 | -11.47% | 33,529 |
| Alexander | 4,477 | 51.83% | 4,143 | 47.96% | 18 | 0.21% | 334 | 3.87% | 8,638 |
| Bond | 2,856 | 39.88% | 4,297 | 60.00% | 9 | 0.13% | -1,441 | -20.12% | 7,162 |
| Boone | 2,605 | 28.43% | 6,552 | 71.51% | 5 | 0.05% | -3,947 | -43.08% | 9,162 |
| Brown | 1,849 | 49.44% | 1,889 | 50.51% | 2 | 0.05% | -40 | -1.07% | 3,740 |
| Bureau | 7,786 | 38.15% | 12,597 | 61.73% | 24 | 0.12% | -4,811 | -23.58% | 20,407 |
| Calhoun | 1,608 | 49.22% | 1,654 | 50.63% | 5 | 0.15% | -46 | -1.41% | 3,267 |
| Carroll | 3,097 | 32.88% | 6,282 | 66.70% | 39 | 0.41% | -3,185 | -33.82% | 9,418 |
| Cass | 3,692 | 47.85% | 4,015 | 52.04% | 8 | 0.10% | -323 | -4.19% | 7,715 |
| Champaign | 17,115 | 37.66% | 27,793 | 61.16% | 533 | 1.17% | -10,678 | -23.50% | 45,441 |
| Christian | 10,207 | 52.38% | 9,263 | 47.54% | 15 | 0.08% | 944 | 4.84% | 19,485 |
| Clark | 3,949 | 42.59% | 5,319 | 57.36% | 5 | 0.05% | -1,370 | -14.77% | 9,273 |
| Clay | 3,394 | 39.75% | 5,134 | 60.13% | 10 | 0.12% | -1,740 | -20.38% | 8,538 |
| Clinton | 6,188 | 51.99% | 5,709 | 47.96% | 6 | 0.05% | 479 | 4.02% | 11,903 |
| Coles | 8,629 | 41.46% | 12,166 | 58.45% | 19 | 0.09% | -3,537 | -16.99% | 20,814 |
| Cook | 1,378,343 | 56.37% | 1,059,607 | 43.33% | 7,319 | 0.30% | 318,736 | 13.03% | 2,445,269 |
| Crawford | 4,245 | 38.39% | 6,809 | 61.58% | 4 | 0.04% | -2,564 | -23.19% | 11,058 |
| Cumberland | 2,475 | 45.00% | 3,020 | 54.91% | 5 | 0.09% | -545 | -9.91% | 5,500 |
| DeKalb | 6,783 | 30.30% | 15,586 | 69.62% | 19 | 0.08% | -8,803 | -39.32% | 22,388 |
| DeWitt | 3,607 | 41.51% | 5,074 | 58.40% | 8 | 0.09% | -1,467 | -16.88% | 8,689 |
| Douglas | 3,532 | 37.98% | 5,761 | 61.95% | 6 | 0.06% | -2,229 | -23.97% | 9,299 |
| DuPage | 44,263 | 30.43% | 101,014 | 69.45% | 168 | 0.12% | -56,751 | -39.02% | 145,445 |
| Edgar | 5,024 | 40.59% | 7,348 | 59.37% | 4 | 0.03% | -2,324 | -18.78% | 12,376 |
| Edwards | 1,446 | 30.47% | 3,291 | 69.36% | 8 | 0.17% | -1,845 | -38.88% | 4,745 |
| Effingham | 5,676 | 46.94% | 6,410 | 53.01% | 6 | 0.05% | -734 | -6.07% | 12,092 |
| Fayette | 4,907 | 42.65% | 6,586 | 57.25% | 11 | 0.10% | -1,679 | -14.59% | 11,504 |
| Ford | 2,698 | 31.82% | 5,779 | 68.16% | 1 | 0.01% | -3,081 | -36.34% | 8,478 |
| Franklin | 11,368 | 48.86% | 11,861 | 50.98% | 37 | 0.16% | -493 | -2.12% | 23,266 |
| Fulton | 10,194 | 45.81% | 11,999 | 53.93% | 58 | 0.26% | -1,805 | -8.11% | 22,251 |
| Gallatin | 2,386 | 52.21% | 2,179 | 47.68% | 5 | 0.11% | 207 | 4.53% | 4,570 |
| Greene | 3,847 | 46.10% | 4,487 | 53.78% | 10 | 0.12% | -640 | -7.67% | 8,344 |
| Grundy | 4,276 | 38.08% | 6,948 | 61.88% | 4 | 0.04% | -2,672 | -23.80% | 11,228 |
| Hamilton | 2,639 | 40.89% | 3,804 | 58.94% | 11 | 0.17% | -1,165 | -18.05% | 6,454 |
| Hancock | 4,947 | 38.08% | 8,036 | 61.86% | 7 | 0.05% | -3,089 | -23.78% | 12,990 |
| Hardin | 1,465 | 42.92% | 1,944 | 56.96% | 4 | 0.12% | -479 | -14.03% | 3,413 |
| Henderson | 1,697 | 39.71% | 2,572 | 60.19% | 4 | 0.09% | -875 | -20.48% | 4,273 |
| Henry | 10,372 | 42.01% | 14,297 | 57.91% | 21 | 0.09% | -3,925 | -15.90% | 24,690 |
| Iroquois | 5,821 | 33.82% | 11,376 | 66.09% | 16 | 0.09% | -5,555 | -32.27% | 17,213 |
| Jackson | 8,527 | 44.62% | 10,568 | 55.30% | 17 | 0.09% | -2,041 | -10.68% | 19,112 |
| Jasper | 3,027 | 47.14% | 3,393 | 52.84% | 1 | 0.02% | -366 | -5.70% | 6,421 |
| Jefferson | 7,784 | 44.16% | 9,841 | 55.84% | 0 | 0.00% | -2,057 | -11.67% | 17,625 |
| Jersey | 4,087 | 48.99% | 4,247 | 50.90% | 9 | 0.11% | -160 | -1.92% | 8,343 |
| Jo Daviess | 4,293 | 41.21% | 6,111 | 58.66% | 13 | 0.12% | -1,818 | -17.45% | 10,417 |
| Johnson | 1,413 | 33.67% | 2,778 | 66.19% | 6 | 0.14% | -1,365 | -32.52% | 4,197 |
| Kane | 31,279 | 36.05% | 55,389 | 63.84% | 93 | 0.11% | -24,110 | -27.79% | 86,761 |
| Kankakee | 17,115 | 45.70% | 20,311 | 54.23% | 26 | 0.07% | -3,196 | -8.53% | 37,452 |
| Kendall | 2,242 | 27.25% | 5,975 | 72.62% | 11 | 0.13% | -3,733 | -45.37% | 8,228 |
| Knox | 11,889 | 39.83% | 17,938 | 60.09% | 23 | 0.08% | -6,049 | -20.26% | 29,850 |
| Lake | 46,941 | 40.85% | 67,809 | 59.02% | 149 | 0.13% | -20,868 | -18.16% | 114,899 |
| LaSalle | 27,532 | 49.94% | 27,552 | 49.98% | 41 | 0.07% | -20 | -0.04% | 55,125 |
| Lawrence | 3,667 | 37.42% | 6,120 | 62.45% | 13 | 0.13% | -2,453 | -25.03% | 9,800 |
| Lee | 5,896 | 35.22% | 10,835 | 64.73% | 8 | 0.05% | -4,939 | -29.51% | 16,739 |
| Livingston | 6,642 | 33.57% | 13,139 | 66.42% | 2 | 0.01% | -6,497 | -32.84% | 19,783 |
| Logan | 5,691 | 37.71% | 9,383 | 62.18% | 16 | 0.11% | -3,692 | -24.47% | 15,090 |
| Macon | 26,029 | 48.85% | 27,151 | 50.95% | 108 | 0.20% | -1,122 | -2.11% | 53,288 |
| Macoupin | 13,120 | 52.70% | 11,731 | 47.12% | 45 | 0.18% | 1,389 | 5.58% | 24,896 |
| Madison | 54,787 | 55.96% | 42,984 | 43.90% | 133 | 0.14% | 11,803 | 12.06% | 97,904 |
| Marion | 9,116 | 45.02% | 11,121 | 54.92% | 13 | 0.06% | -2,005 | -9.90% | 20,250 |
| Marshall | 2,981 | 41.76% | 4,150 | 58.14% | 7 | 0.10% | -1,169 | -16.38% | 7,138 |
| Mason | 3,824 | 46.75% | 4,337 | 53.02% | 19 | 0.23% | -513 | -6.27% | 8,180 |
| Massac | 2,644 | 36.87% | 4,521 | 63.05% | 6 | 0.08% | -1,877 | -26.17% | 7,171 |
| McDonough | 4,520 | 32.53% | 9,363 | 67.39% | 10 | 0.07% | -4,843 | -34.86% | 13,893 |
| McHenry | 12,659 | 32.87% | 25,787 | 66.97% | 62 | 0.16% | -13,128 | -34.09% | 38,508 |
| McLean | 13,971 | 36.04% | 24,758 | 63.87% | 32 | 0.08% | -10,787 | -27.83% | 38,761 |
| Menard | 2,068 | 39.82% | 3,120 | 60.08% | 5 | 0.10% | -1,052 | -20.26% | 5,193 |
| Mercer | 3,476 | 38.36% | 5,582 | 61.60% | 3 | 0.03% | -2,106 | -23.24% | 9,061 |
| Monroe | 3,398 | 41.78% | 4,731 | 58.17% | 4 | 0.05% | -1,333 | -16.39% | 8,133 |
| Montgomery | 8,815 | 48.95% | 9,178 | 50.97% | 14 | 0.08% | -363 | -2.02% | 18,007 |
| Morgan | 7,259 | 42.54% | 9,791 | 57.38% | 12 | 0.07% | -2,532 | -14.84% | 17,062 |
| Moultrie | 3,079 | 45.07% | 3,752 | 54.93% | 0 | 0.00% | -673 | -9.85% | 6,831 |
| Ogle | 4,792 | 26.59% | 13,226 | 73.38% | 7 | 0.04% | -8,434 | -46.79% | 18,025 |
| Peoria | 39,061 | 46.13% | 45,529 | 53.77% | 86 | 0.10% | -6,468 | -7.64% | 84,676 |
| Perry | 4,958 | 42.48% | 6,708 | 57.47% | 6 | 0.05% | -1,750 | -14.99% | 11,672 |
| Piatt | 2,889 | 39.05% | 4,506 | 60.90% | 4 | 0.05% | -1,617 | -21.85% | 7,399 |
| Pike | 5,461 | 47.75% | 5,965 | 52.16% | 10 | 0.09% | -504 | -4.41% | 11,436 |
| Pope | 971 | 36.44% | 1,689 | 63.38% | 5 | 0.19% | -718 | -26.94% | 2,665 |
| Pulaski | 2,322 | 46.81% | 2,621 | 52.83% | 18 | 0.36% | -299 | -6.03% | 4,961 |
| Putnam | 1,160 | 44.29% | 1,457 | 55.63% | 2 | 0.08% | -297 | -11.34% | 2,619 |
| Randolph | 7,344 | 47.85% | 7,988 | 52.05% | 15 | 0.10% | -644 | -4.20% | 15,347 |
| Richland | 3,015 | 36.09% | 5,329 | 63.80% | 9 | 0.11% | -2,314 | -27.70% | 8,353 |
| Rock Island | 33,812 | 50.88% | 32,534 | 48.96% | 108 | 0.16% | 1,278 | 1.92% | 66,454 |
| Saline | 6,835 | 43.52% | 8,853 | 56.36% | 19 | 0.12% | -2,018 | -12.85% | 15,707 |
| Sangamon | 35,793 | 46.28% | 41,483 | 53.64% | 59 | 0.08% | -5,690 | -7.36% | 77,335 |
| Schuyler | 2,115 | 40.96% | 3,047 | 59.00% | 2 | 0.04% | -932 | -18.05% | 5,164 |
| Scott | 1,543 | 40.46% | 2,267 | 59.44% | 4 | 0.10% | -724 | -18.98% | 3,814 |
| Shelby | 5,720 | 45.39% | 6,872 | 54.53% | 11 | 0.09% | -1,152 | -9.14% | 12,603 |
| St. Clair | 67,367 | 61.38% | 42,046 | 38.31% | 338 | 0.31% | 25,321 | 23.07% | 109,751 |
| Stark | 1,383 | 32.06% | 2,925 | 67.80% | 6 | 0.14% | -1,542 | -35.74% | 4,314 |
| Stephenson | 8,055 | 36.62% | 13,872 | 63.07% | 68 | 0.31% | -5,817 | -26.45% | 21,995 |
| Tazewell | 20,521 | 46.09% | 23,967 | 53.83% | 38 | 0.09% | -3,446 | -7.74% | 44,526 |
| Union | 4,321 | 49.31% | 4,432 | 50.58% | 10 | 0.11% | -111 | -1.27% | 8,763 |
| Vermilion | 19,702 | 42.51% | 26,571 | 57.34% | 69 | 0.15% | -6,869 | -14.82% | 46,342 |
| Wabash | 3,013 | 41.40% | 4,261 | 58.55% | 4 | 0.05% | -1,248 | -17.15% | 7,278 |
| Warren | 3,835 | 34.66% | 7,221 | 65.25% | 10 | 0.09% | -3,386 | -30.60% | 11,066 |
| Washington | 3,093 | 37.92% | 5,053 | 61.95% | 11 | 0.13% | -1,960 | -24.03% | 8,157 |
| Wayne | 3,954 | 37.25% | 6,652 | 62.67% | 9 | 0.08% | -2,698 | -25.42% | 10,615 |
| White | 4,756 | 44.97% | 5,810 | 54.93% | 11 | 0.10% | -1,054 | -9.97% | 10,577 |
| Whiteside | 9,112 | 34.27% | 17,434 | 65.56% | 46 | 0.17% | -8,322 | -31.30% | 26,592 |
| Will | 41,056 | 49.04% | 42,575 | 50.86% | 81 | 0.10% | -1,519 | -1.81% | 83,712 |
| Williamson | 11,335 | 45.17% | 13,732 | 54.72% | 29 | 0.12% | -2,397 | -9.55% | 25,096 |
| Winnebago | 40,090 | 44.67% | 49,541 | 55.20% | 110 | 0.12% | -9,451 | -10.53% | 89,741 |
| Woodford | 4,401 | 35.18% | 8,101 | 64.76% | 7 | 0.06% | -3,700 | -29.58% | 12,509 |
| Totals | 2,377,846 | 49.98% | 2,368,988 | 49.80% | 10,575 | 0.22% | 8,858 | 0.19% | 4,757,409 |
References
- "United States Presidential election of 1960 - Encyclopædia Britannica". Retrieved June 8, 2017.
- "1960 Election for the Forty-Fourth Term (1961-65)". Retrieved June 8, 2017.
- "1960 Presidential General Election Results - Illinois". Retrieved June 8, 2017.
- "The American Presidency Project - Election of 1960". Retrieved June 8, 2017.
- Illinois Blue Book 1959-1960. www.idaillinois.org. Illinois Secretary of State. p. 871. Retrieved 31 March 2020.
- "OFFICIAL VOTE Cast at the GENERAL ELECTION NOVEMBER 4, 1986" (PDF). www.elections.il.gov. Illinois State Board of Elections. Retrieved 10 April 2020.
- Illinois Blue Book 1961-1962. www.idaillinois.org. Illinois Secretary of State. p. 963. Retrieved 31 March 2020.
- "OFFICIAL VOTE OF THE STATE OF ILLINOIS Cast at the GENERAL ELECTION, NOVEMBER 8, 1960 JUDICIAL ELECTION 1959-1960 • PRIMARY ELECTION GENERAL PRIMARY, APRIL 12 1960" (PDF). Illinois State Board of Elections. Retrieved 4 July 2020.
- Oliphant, Thomas; Wilkie, Curtis (2017). The road to Camelot: Inside JFK's Five-Year Campaign. Simon & Schuster.
- "OFFICIAL VOTE OF THE STATE OF ILLINOIS Cast at the GENERAL ELECTION, NOVEMBER 8, 1960 JUDICIAL ELECTION 1959-1960 • PRIMARY ELECTION GENERAL PRIMARY, APRIL 12 1960" (PDF). Illinois State Board of Elections. Retrieved 4 July 2020.
- "RESULTS OF 1960 PRESIDENTIAL ELECTION PRIMARIES". John F. Kennedy presidential library. Retrieved January 18, 2019.
- "The fallacy of Nixon's graceful exit". Salon. November 10, 2000. Retrieved May 12, 2016.
- Greenberg, David (October 16, 2000). "Was Nixon Robbed?". Slate.
- "Another Race To the Finish". The Washington Post. November 17, 2000. Retrieved May 12, 2016.
- von Hippel, Paul (August 8, 2017). "Here's a voter fraud myth: Richard Daley 'stole' Illinois for John Kennedy in the 1960 election?". The Washington Post.
- Scammon, Richard M. (compiler); America at the Polls: A Handbook of Presidential Election Statistics 1920-1964; pp. 134-135 ISBN 0405077114
_A.jpg)
.jpg)
