Douglas County, Illinois
Douglas County is a county located in the U.S. state of Illinois. As of the 2010 United States Census, the population was 19,980.[1] The county seat is Tuscola.[2]
Douglas County | |
|---|---|
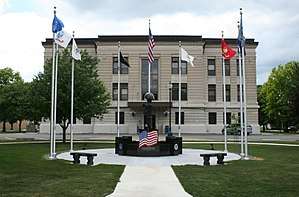 Douglas County Courthouse and veterans' memorial | |
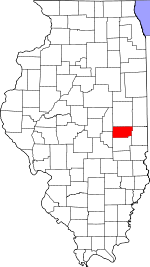 Location within the U.S. state of Illinois | |
 Illinois's location within the U.S. | |
| Coordinates: 39°46′N 88°13′W | |
| Country | |
| State | |
| Founded | 1859 |
| Named for | Stephen A. Douglas |
| Seat | Tuscola |
| Largest city | Tuscola |
| Area | |
| • Total | 417 sq mi (1,080 km2) |
| • Land | 416 sq mi (1,080 km2) |
| • Water | 0.6 sq mi (2 km2) 0.1% |
| Population (2010) | |
| • Total | 19,980 |
| • Estimate (2018) | 19,479 |
| • Density | 48/sq mi (18/km2) |
| Time zone | UTC−6 (Central) |
| • Summer (DST) | UTC−5 (CDT) |
| Congressional district | 15th |
| Website | www |
History
Douglas County was formed in 1859 out of Coles County. It was named for Stephen A. Douglas,[3] who was elected to the United States Senate in 1858, following the Lincoln-Douglas Debates.
 The creation of Douglas and Ford Counties in 1859 resulted in Illinois' current county map.
Geography
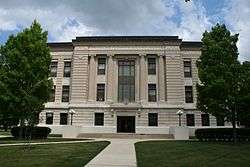
According to the US Census Bureau, the county has a total area of 417 square miles (1,080 km2), of which 417 square miles (1,080 km2) is land and 0.6 square miles (1.6 km2) (0.1%) is water.[4]
Climate and weather
| Tuscola, Illinois | ||||||||||||||||||||||||||||||||||||||||||||||||||||||||||||
|---|---|---|---|---|---|---|---|---|---|---|---|---|---|---|---|---|---|---|---|---|---|---|---|---|---|---|---|---|---|---|---|---|---|---|---|---|---|---|---|---|---|---|---|---|---|---|---|---|---|---|---|---|---|---|---|---|---|---|---|---|
| Climate chart (explanation) | ||||||||||||||||||||||||||||||||||||||||||||||||||||||||||||
| ||||||||||||||||||||||||||||||||||||||||||||||||||||||||||||
| ||||||||||||||||||||||||||||||||||||||||||||||||||||||||||||
In recent years, average temperatures in the county seat of Tuscola have ranged from a low of 18 °F (−8 °C) in January to a high of 88 °F (31 °C) in July, although a record low of −26 °F (−32 °C) was recorded in December 1989 and a record high of 113 °F (45 °C) was recorded in July 1954. Average monthly precipitation ranged from 2.12 inches (54 mm) in February to 4.64 inches (118 mm) in July.[5]
Adjacent counties
- Champaign County - north
- Vermilion County - northeast
- Edgar County - east
- Coles County - south
- Moultrie County - west
- Piatt County - northwest
Major highways


Demographics
| Historical population | |||
|---|---|---|---|
| Census | Pop. | %± | |
| 1860 | 7,140 | — | |
| 1870 | 13,484 | 88.9% | |
| 1880 | 15,853 | 17.6% | |
| 1890 | 17,669 | 11.5% | |
| 1900 | 19,097 | 8.1% | |
| 1910 | 19,591 | 2.6% | |
| 1920 | 19,604 | 0.1% | |
| 1930 | 17,914 | −8.6% | |
| 1940 | 17,590 | −1.8% | |
| 1950 | 16,706 | −5.0% | |
| 1960 | 19,243 | 15.2% | |
| 1970 | 18,997 | −1.3% | |
| 1980 | 19,774 | 4.1% | |
| 1990 | 19,464 | −1.6% | |
| 2000 | 19,922 | 2.4% | |
| 2010 | 19,980 | 0.3% | |
| Est. 2018 | 19,479 | [6] | −2.5% |
| US Decennial Census[7] 1790-1960[8] 1900-1990[9] 1990-2000[10] 2010-2014[1] | |||
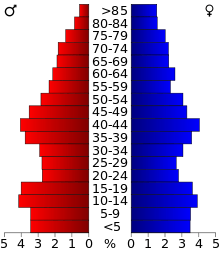
As of the 2010 United States Census, there were 19,980 people, 7,720 households, and 5,377 families living in the county.[11] The population density was 48.0 inhabitants per square mile (18.5/km2). There were 8,390 housing units at an average density of 20.1 per square mile (7.8/km2).[4] The racial makeup of the county was 95.7% white, 0.4% Asian, 0.3% black or African American, 0.2% American Indian, 2.3% from other races, and 1.2% from two or more races. Those of Hispanic or Latino origin made up 6.1% of the population.[11] In terms of ancestry, 29.6% were German, 12.6% were American, 12.1% were English, and 10.7% were Irish.[12]
Of the 7,720 households, 32.6% had children under the age of 18 living with them, 57.0% were married couples living together, 8.5% had a female householder with no husband present, 30.3% were non-families, and 26.1% of all households were made up of individuals. The average household size was 2.57 and the average family size was 3.11. The median age was 38.7 years.[11]
The median income for a household in the county was $46,941 and the median income for a family was $60,352. Males had a median income of $41,318 versus $28,731 for females. The per capita income for the county was $21,438. About 7.1% of families and 10.2% of the population were below the poverty line, including 14.0% of those under age 18 and 7.2% of those age 65 or over.[13]
Communities
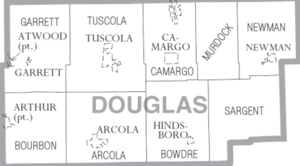
Cities
- Arcola
- Newman
- Tuscola (seat)
- Villa Grove
Unincorporated communities
Politics
Douglas is a strongly Republican county. Apart from a narrow plurality of thirty-two votes to Bill Clinton in 1992, it has voted Republican in every Presidential election since 1968, and in all but five overall since 1880. Despite its long-time Republican leanings, Hillary Clinton’s 2016 performance of gaining a mere 23.8 percent of the county’s vote stands over six percent worse than any Democrat since the Civil War.
| Year | Republican | Democratic | Third parties |
|---|---|---|---|
| 2016 | 69.5% 5,698 | 23.8% 1,949 | 6.7% 548 |
| 2012 | 67.3% 5,334 | 30.7% 2,430 | 2.0% 157 |
| 2008 | 59.7% 5,005 | 38.5% 3,228 | 1.7% 146 |
| 2004 | 66.8% 5,702 | 32.4% 2,767 | 0.8% 71 |
| 2000 | 58.1% 4,734 | 39.4% 3,215 | 2.5% 203 |
| 1996 | 46.7% 3,272 | 42.1% 2,955 | 11.2% 786 |
| 1992 | 40.0% 3,309 | 40.4% 3,341 | 19.6% 1,626 |
| 1988 | 57.6% 4,378 | 41.9% 3,184 | 0.5% 36 |
| 1984 | 66.1% 5,691 | 33.5% 2,886 | 0.3% 27 |
| 1980 | 64.3% 5,330 | 30.9% 2,564 | 4.8% 400 |
| 1976 | 54.4% 4,635 | 44.9% 3,826 | 0.7% 61 |
| 1972 | 68.7% 5,840 | 31.2% 2,656 | 0.1% 10 |
| 1968 | 59.3% 5,058 | 33.1% 2,824 | 7.7% 655 |
| 1964 | 47.4% 4,223 | 52.7% 4,695 | |
| 1960 | 62.0% 5,761 | 38.0% 3,532 | 0.1% 6 |
| 1956 | 66.7% 5,559 | 33.3% 2,774 | 0.1% 6 |
| 1952 | 67.1% 5,530 | 32.8% 2,706 | 0.1% 5 |
| 1948 | 58.7% 4,181 | 40.6% 2,893 | 0.8% 55 |
| 1944 | 58.3% 4,684 | 41.4% 3,323 | 0.4% 28 |
| 1940 | 54.3% 5,451 | 45.0% 4,513 | 0.7% 67 |
| 1936 | 47.5% 4,606 | 51.9% 5,029 | 0.6% 59 |
| 1932 | 37.7% 3,108 | 60.2% 4,954 | 2.1% 174 |
| 1928 | 68.2% 4,890 | 31.2% 2,239 | 0.6% 42 |
| 1924 | 55.7% 4,046 | 31.8% 2,315 | 12.5% 909 |
| 1920 | 65.2% 4,885 | 30.8% 2,308 | 4.0% 298 |
| 1916 | 52.2% 4,564 | 43.1% 3,768 | 4.8% 416 |
| 1912 | 31.0% 1,386 | 36.6% 1,633 | 32.5% 1,448 |
| 1908 | 55.3% 2,656 | 39.9% 1,917 | 4.7% 227 |
| 1904 | 54.8% 2,518 | 36.7% 1,685 | 8.5% 392 |
| 1900 | 55.5% 2,733 | 42.7% 2,106 | 1.8% 89 |
| 1896 | 54.8% 2,666 | 44.0% 2,140 | 1.3% 61 |
| 1892 | 50.5% 2,246 | 44.9% 1,999 | 4.6% 204 |
References
- "State & County QuickFacts". US Census Bureau. Archived from the original on June 6, 2011. Retrieved July 4, 2014.
- "Find a County". National Association of Counties. Archived from the original on May 31, 2011. Retrieved June 7, 2011.
- Gannett, Henry (1905). The Origin of Certain Place Names in the United States. Govt. Print. Off. p. 108.
- "Population, Housing Units, Area, and Density: 2010 - County". US Census Bureau. Archived from the original on February 12, 2020. Retrieved July 11, 2015.
- "Monthly Averages for Tuscola IL". The Weather Channel. Retrieved January 27, 2011.
- "Population and Housing Unit Estimates". Retrieved November 6, 2019.
- "US Decennial Census". US Census Bureau. Retrieved July 4, 2014.
- "Historical Census Browser". University of Virginia Library. Retrieved July 4, 2014.
- "Population of Counties by Decennial Census: 1900 to 1990". US Census Bureau. Retrieved July 4, 2014.
- "Census 2000 PHC-T-4. Ranking Tables for Counties: 1990 and 2000" (PDF). US Census Bureau. Retrieved July 4, 2014.
- "Profile of General Population and Housing Characteristics: 2010 Demographic Profile Data". US Census Bureau. Archived from the original on February 13, 2020. Retrieved July 11, 2015.
- "Selected Social Characteristics in the United States – 2006-2010 American Community Survey 5-Year Estimates". US Census Bureau. Archived from the original on February 13, 2020. Retrieved July 11, 2015.
- "Selected Economic Characteristics – 2006-2010 American Community Survey 5-Year Estimates". US Census Bureau. Archived from the original on February 13, 2020. Retrieved July 11, 2015.
- West Ridge, Douglas County IL Google Maps (accessed 30 December 2018)
- Leip, David. "Atlas of US Presidential Elections". uselectionatlas.org. Retrieved November 1, 2018.
External links
| Wikimedia Commons has media related to Douglas County, Illinois. |
