1936 United States presidential election in Vermont
The 1936 United States presidential election in Vermont took place on November 3, 1936, as part of the 1936 United States presidential election which was held throughout all contemporary 48 states. Voters chose three representatives, or electors to the Electoral College, who voted for president and vice president.
| ||||||||||||||||||||||||||
| ||||||||||||||||||||||||||
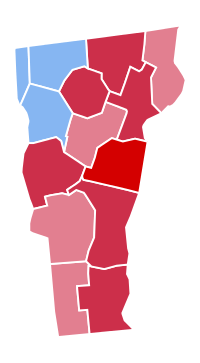
 County Results
| ||||||||||||||||||||||||||
| ||||||||||||||||||||||||||
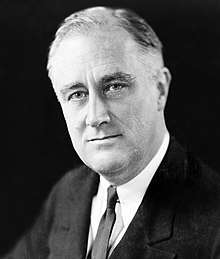
Vermont voted for the Republican nominee, Kansas Governor Alf Landon, over the Democratic nominee, incumbent President Franklin D. Roosevelt of New York. Landon’s running mate was newspaper publisher Frank Knox of Illinois, while Roosevelt ran with incumbent Vice President John Nance Garner of Texas.
Landon took 56.39% of the vote, to Roosevelt’s 43.24%, a margin of 13.15%.
Vermont historically was a bastion of liberal Northeastern Republicanism, and by 1936 the Green Mountain State had gone Republican in every presidential election since the founding of the Republican Party. From 1856 to 1932, Vermont had had the longest streak of voting Republican of any state, having never voted Democratic before, and this tradition continued even in the midst of a nationwide Democratic landslide in 1936. It would not vote Democratic until 1964.
Vermont had been one of only six states to vote to re-elect embattled incumbent Republican President Herbert Hoover over FDR in the latter’s 1932 landslide, and in 1936, it was one of only two states in the entire nation (along with nearby Maine) to vote for Alf Landon over the wildly popular Roosevelt. Vermont and Maine ultimately would be the only states to reject FDR in all four of his presidential campaigns.
In terms of vote share, Vermont was the most Republican state in the nation,[1] and in terms of margin, it was the second most Republican state after Maine, as populist William Lemke took votes away from Roosevelt in Maine but was not on the ballot in Vermont. Vermont would weigh in as a whopping 37% more Republican than the national average in the 1936 election.
Landon carried eleven of the state’s fourteen counties, breaking 60% in seven. However, the three northwestern counties of Vermont had become Democratic enclaves in an otherwise Republican state, and Roosevelt once again won Chittenden, Franklin and Grand Isle counties for the Democrats.
As of 2016, even after a quarter-century as a classic “blue” state that usually supports Democratic presidential candidates, Vermont has voted for more Republican presidential nominees than any other state. From 1856 through 1960 and from 1968 to 1988, Vermont gave the state’s electoral votes to the Republican Party nominee in every presidential election. No other state has voted so many times in a row for candidates of the same political party.
Results
| 1936 United States presidential election in Vermont[2] | |||||
|---|---|---|---|---|---|
| Party | Candidate | Votes | Percentage | Electoral votes | |
| Republican | Alfred Landon | 81,023 | 56.39% | 3 | |
| Democratic | Franklin D. Roosevelt | 62,124 | 43.24% | 0 | |
| Communist | Earl Browder | 405 | 0.28% | 0 | |
| N/A | Write-ins | 137 | 0.10% | 0 | |
| Totals | 143,689 | 100.00% | 3 | ||
Results by county
| County | Alfred Mossman Landon Republican |
Franklin Delano Roosevelt Democratic |
Various candidates Other parties |
Margin | Total votes cast[3] | ||||
|---|---|---|---|---|---|---|---|---|---|
| # | % | # | % | # | % | # | % | ||
| Addison | 5,161 | 65.90% | 2,646 | 33.79% | 24 | 0.31% | 2,515 | 32.12% | 7,831 |
| Bennington | 5,515 | 56.08% | 4,166 | 42.36% | 153 | 1.56% | 1,349 | 13.72% | 9,834 |
| Caledonia | 6,054 | 64.25% | 3,342 | 35.47% | 27 | 0.29% | 2,712 | 28.78% | 9,423 |
| Chittenden | 7,757 | 41.32% | 10,962 | 58.39% | 56 | 0.30% | -3,205 | -17.07% | 18,775 |
| Essex | 1,474 | 55.00% | 1,203 | 44.89% | 3 | 0.11% | 271 | 10.11% | 2,680 |
| Franklin | 5,507 | 44.56% | 6,817 | 55.15% | 36 | 0.29% | -1,310 | -10.60% | 12,360 |
| Grand Isle | 712 | 45.41% | 852 | 54.34% | 4 | 0.26% | -140 | -8.93% | 1,568 |
| Lamoille | 2,846 | 68.79% | 1,279 | 30.92% | 12 | 0.29% | 1,567 | 37.88% | 4,137 |
| Orange | 4,956 | 73.28% | 1,796 | 26.56% | 11 | 0.16% | 3,160 | 46.72% | 6,763 |
| Orleans | 5,038 | 65.26% | 2,662 | 34.48% | 20 | 0.26% | 2,376 | 30.78% | 7,720 |
| Rutland | 10,794 | 52.94% | 9,543 | 46.80% | 54 | 0.26% | 1,251 | 6.14% | 20,391 |
| Washington | 8,351 | 50.67% | 8,073 | 48.99% | 56 | 0.34% | 278 | 1.69% | 16,480 |
| Windham | 7,369 | 66.42% | 3,699 | 33.34% | 27 | 0.24% | 3,670 | 33.08% | 11,095 |
| Windsor | 9,489 | 64.90% | 5,084 | 34.77% | 49 | 0.34% | 4,405 | 30.13% | 14,622 |
| Totals | 81,023 | 56.39% | 62,124 | 43.24% | 532 | 0.37% | 18,899 | 13.15% | 143,679 |
See also
- United States presidential elections in Vermont
- 1936 United States presidential election in Maine - Alf Landon's other sole win in 1936
References
- "1936 Presidential Election Statistics". Dave Leip’s Atlas of U.S. Presidential Elections. Retrieved 2018-03-05.
- "1936 Presidential General Election Results - Vermont". Dave Leip's Atlas of U.S. Presidential Elections. Retrieved 2013-08-02.
- Scammon, Richard M. (compiler); America at the Polls: A Handbook of Presidential Election Statistics 1920-1964; p. 465 ISBN 0405077114


.svg.png)
