Vancouver South
Vancouver South (French: Vancouver-Sud) is a federal electoral district in British Columbia, Canada, that has been represented in the House of Commons of Canada from 1917 to 1997, and since 2004. It covers the southern portion of the city of Vancouver, British Columbia.
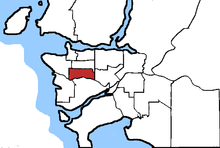 Vancouver South in relation to other federal electoral districts in Vancouver | |||
| Federal electoral district | |||
| Legislature | House of Commons | ||
| MP |
Liberal | ||
| District created | 2003 | ||
| First contested | 2004 | ||
| Last contested | 2019 | ||
| District webpage | profile, map | ||
| Demographics | |||
| Population (2011)[1] | 100,966 | ||
| Electors (2015) | 68,733 | ||
| Area (km²)[1] | 21 | ||
| Pop. density (per km²) | 4,807.9 | ||
| Census divisions | Metro Vancouver | ||
| Census subdivisions | Vancouver | ||
Demographics
Pie chart of the ethnic breakdown of Vancouver South from the 2016 census.
The riding is one of the most diverse in Canada.[2] As of 2016, four ethnic groups form more than 10% of the riding; 37.9% Chinese, 21.8% European, 17.2% South Asian and 11.3% Filipino.
Vancouver South is the centre of the city's South Asian community; the colourful Punjabi market and the close-knit community of religious Sikhs dominate the area.[3] The service sector, retail trade and manufacturing are the major sources of employment in Vancouver South. Nearly 30% of residents over the age of 25 years have obtained a university certificate or degree. The average family income is over $71,000. Unemployment is around 6.3%.[4]
| Ethnic groups in Vancouver South (2016) Source: | Population | % | |
|---|---|---|---|
| Ethnic group | Chinese | 39,005 | 37.9% |
| European | 22,470 | 21.8% | |
| South Asian | 17,655 | 17.2% | |
| Filipino | 11,680 | 11.3% | |
| Southeast Asian | 3,680 | 3.6% | |
| Latin American | 1,950 | 1.9% | |
| Aboriginal | 1,640 | 1.6% | |
| Japanese | 1,085 | 1.1% | |
| Black | 1,070 | 1% | |
| Korean | 1,025 | 1% | |
| West Asian | 525 | 0.5% | |
| Arab | 315 | 0.3% | |
| Multiple minorities | 2,460 | 2.4% | |
| Visible minority, n.i.e. | 285 | 0.3% | |
| Total population | 102,927 | 100% | |
History
This electoral district was formed in 1914 from Vancouver City riding.
In 1996, it was abolished and used to create Vancouver South—Burnaby with portions of New Westminster—Burnaby.
Vancouver South was re-created in 2003 when the Burnaby sections were moved into the new ridings Burnaby—Douglas and Burnaby—New Westminster.
The 2012 federal electoral boundaries redistribution concluded that the electoral boundaries of Vancouver South should be adjusted, and a modified electoral district of the same name will be contested in future elections.[5] The redefined Vancouver South loses a portion of its current territory west of Cambie Street to the new district of Vancouver Granville, and gains a small area in the northeast currently included in Vancouver Kingsway. These new boundaries were legally defined in the 2013 representation order, which came into effect upon the call of the 42nd Canadian federal election, scheduled for October 2015.[6]
Members of Parliament
This riding has elected the following Members of Parliament:
Election results
Vancouver South, 2004–present
Its current representing MP is Harjit Sajjan, who is Minister of Defence in the current federal Cabinet. He has been its MP since the 2015 federal election, when he beat the Conservative then-incumbent by more than 6,000 votes.
| 2019 Canadian federal election | ||||||||
|---|---|---|---|---|---|---|---|---|
| Party | Candidate | Votes | % | ±% | Expenditures | |||
| Liberal | Harjit Sajjan | 17,808 | 41.2 | -7.61 | ||||
| Conservative | Wai Young | 14,388 | 33.3 | -0.58 | ||||
| New Democratic | Sean McQuillan | 8,015 | 18.6 | +4.63 | ||||
| Green | Judy Zaichkowsky | 2,451 | 5.7 | +3.12 | ||||
| People's | Alain Deng | 532 | 1.2 | – | ||||
| Total valid votes/Expense limit | 43,194 | 100.0 | ||||||
| Total rejected ballots | 431 | |||||||
| Turnout | 43,625 | 58.9 | ||||||
| Eligible voters | 74,114 | |||||||
| Liberal hold | Swing | - | ||||||
| Source: Elections Canada[7][8] | ||||||||
| 2015 Canadian federal election | ||||||||
|---|---|---|---|---|---|---|---|---|
| Party | Candidate | Votes | % | ±% | Expenditures | |||
| Liberal | Harjit Sajjan | 21,773 | 48.81 | +15.05 | $161,402.16 | |||
| Conservative | Wai Young | 15,115 | 33.88 | -8.54 | $118,748.27 | |||
| New Democratic | Amandeep Nijjar | 6,230 | 13.97 | -7.10 | $63,954.79 | |||
| Green | Elain Ng | 1,149 | 2.58 | +0.37 | $5,232.68 | |||
| Marxist–Leninist | Charles Boylan | 178 | 0.40 | -0.09 | – | |||
| Progressive Canadian | Raj Gupta | 166 | 0.37 | – | – | |||
| Total valid votes/Expense limit | 44,611 | 100.00 | $203,440.39 | |||||
| Total rejected ballots | 259 | 0.58 | – | |||||
| Turnout | 44,870 | 64.04 | – | |||||
| Eligible voters | 70,062 | |||||||
| Liberal gain from Conservative | Swing | +11.80 | ||||||
| Source: Elections Canada[9][10] | ||||||||
| 2011 federal election redistributed results[11] | |||
|---|---|---|---|
| Party | Vote | % | |
| Conservative | 15,571 | 42.43 | |
| Liberal | 12,389 | 33.76 | |
| New Democratic | 7,732 | 21.07 | |
| Green | 808 | 2.20 | |
| Others | 202 | 0.55 | |
| 2011 Canadian federal election | ||||||||
|---|---|---|---|---|---|---|---|---|
| Party | Candidate | Votes | % | ±% | ||||
| Conservative | Wai Young | 19,504 | 43.31 | +4.87 | ||||
| Liberal | Ujjal Dosanjh | 15,604 | 34.65 | -3.84 | ||||
| New Democratic | Meena Wong | 8,552 | 18.99 | +1.37 | ||||
| Green | Jean Hakizimana | 1,151 | 2.55 | -2.38 | ||||
| Marxist–Leninist | Charles Boylan | 222 | 0.49 | -0.01 | ||||
| Total valid votes | 45,033 | 100.0 | ||||||
| Total rejected ballots | 281 | 0.62 | +0.09 | |||||
| Turnout | 45,314 | 55.77 | +3.77 | |||||
| Eligible voters | 81,245 | |||||||
| Conservative gain from Liberal | Swing | +4.36 | ||||||
| 2008 Canadian federal election | ||||||||
|---|---|---|---|---|---|---|---|---|
| Party | Candidate | Votes | % | ±% | Expenditures | |||
| Liberal | Ujjal Dosanjh | 16,110 | 38.49 | -9.56 | $74,163 | |||
| Conservative | Wai Young | 16,090 | 38.44 | +11.30 | $80,086 | |||
| New Democratic | Ann Chambers | 7,376 | 17.62 | -3.45 | $22,765 | |||
| Green | Csaba Gulyas | 2,065 | 4.93 | +1.65 | $413 | |||
| Marxist–Leninist | Charles Boylan | 211 | 0.50 | +0.04 | ||||
| Total valid votes/Expense limit | 41,852 | 100.0 | $85,093 | |||||
| Total rejected ballots | 223 | 0.53 | +0.12 | |||||
| Turnout | 42,075 | 52.00 | -4.00 | |||||
| Liberal hold | Swing | -10.43 | ||||||
| 2006 Canadian federal election | ||||||||
|---|---|---|---|---|---|---|---|---|
| Party | Candidate | Votes | % | ±% | Expenditures | |||
| Liberal | Ujjal Dosanjh | 20,991 | 48.05 | +3.54 | $62,784 | |||
| Conservative | Tarlok Sablok | 11,856 | 27.14 | +1.64 | $68,523 | |||
| New Democratic | Bev Meslo | 9,205 | 21.07 | -3.48 | $30,481 | |||
| Green | Doug Perry | 1,435 | 3.28 | -0.30 | $1,280 | |||
| Marxist–Leninist | Charles Boylan | 202 | 0.46 | +0.17 | ||||
| Total valid votes | 43,689 | 100.0 | ||||||
| Total rejected ballots | 181 | 0.41 | -0.29 | |||||
| Turnout | 43,870 | 56.00 | ||||||
| Liberal hold | Swing | +0.95 | ||||||
| 2004 Canadian federal election | ||||||||
|---|---|---|---|---|---|---|---|---|
| Party | Candidate | Votes | % | Expenditures | ||||
| Liberal | Ujjal Dosanjh | 18,196 | 44.51 | $67,157 | ||||
| Conservative | Victor Soo Chan | 10,426 | 25.50 | $70,471 | ||||
| New Democratic | Bev Meslo | 10,038 | 24.55 | $33,575 | ||||
| Green | Doug Perry | 1,465 | 3.58 | $1,451 | ||||
| Christian Heritage | Frank Wagner | 339 | 0.82 | |||||
| Marxist–Leninist | Charles Boylan | 119 | 0.29 | $150 | ||||
| Communist | Stephen Von Sychowski | 105 | 0.25 | $389 | ||||
| Independent | H. Sandhu | 98 | 0.23 | $5,846 | ||||
| Canadian Action | Joe Sixpack Horrocks | 90 | 0.22 | |||||
| Total valid votes | 40,876 | 100.0 | ||||||
| Total rejected ballots | 284 | 0.69 | ||||||
| Turnout | 41,160 | 56 | ||||||
| This riding was re-created from parts of Vancouver South—Burnaby, which elected a Liberal in the previous election. | ||||||||
Vancouver South, 1917–1997
| 1993 Canadian federal election | ||||||||
|---|---|---|---|---|---|---|---|---|
| Party | Candidate | Votes | % | ±% | ||||
| Liberal | Herb Dhaliwal | 17,215 | 35.62 | +6.83 | ||||
| Reform | Gordon Shreeve | 12,291 | 25.43 | +23.34 | ||||
| Progressive Conservative | K. K. Wan | 11,357 | 23.50 | -18.73 | ||||
| New Democratic | John Maté | 3,625 | 7.50 | -16.26 | ||||
| National | Cameron Ward | 2,113 | 4.37 | – | ||||
| Libertarian | John Clarke | 554 | 1.15 | -0.74 | ||||
| Green | Valerie Jerome | 418 | 0.86 | +0.21 | ||||
| Natural Law | Prince Pabbies | 285 | 0.59 | – | ||||
| Independent | Jas Mangat | 278 | 0.58 | – | ||||
| Independent | Dan Logan | 69 | 0.14 | – | ||||
| Independent | Robert Walter Ross | 60 | 0.12 | – | ||||
| Marxist–Leninist | Allan H. Bezanson | 47 | 0.10 | – | ||||
| Independent | Issam Mansour | 20 | 0.04 | – | ||||
| Total valid votes | 48,332 | 100.0 | ||||||
| Liberal gain from Progressive Conservative | Swing | -8.26 | ||||||
| 1988 Canadian federal election | ||||||||
|---|---|---|---|---|---|---|---|---|
| Party | Candidate | Votes | % | ±% | ||||
| Progressive Conservative | John Allen Fraser | 21,222 | 42.23 | -12.64 | ||||
| Liberal | Woody MacLaren | 14,468 | 28.79 | +8.31 | ||||
| New Democratic | Martin Toren | 11,939 | 23.76 | +0.25 | ||||
| Reform | Don Evans | 1,052 | 2.09 | – | ||||
| Libertarian | John Clarke | 946 | 1.88 | – | ||||
| Green | Douglas Dunn | 327 | 0.65 | -0.49 | ||||
| Rhinoceros | Brian Godzilla Salmi | 173 | 0.34 | – | ||||
| Independent | Barbara Waldern | 74 | 0.15 | – | ||||
| Communist | Reginald Walters | 54 | 0.11 | – | ||||
| Total valid votes | 50,255 | 100.0 | ||||||
| Progressive Conservative hold | Swing | -10.48 | ||||||
| 1984 Canadian federal election | ||||||||
|---|---|---|---|---|---|---|---|---|
| Party | Candidate | Votes | % | ±% | ||||
| Progressive Conservative | John Allen Fraser | 25,469 | 54.87 | +1.59 | ||||
| New Democratic | Brian Ernest Emery | 10,909 | 23.50 | +2.24 | ||||
| Liberal | Harkirpal S. Sara | 9,507 | 20.48 | -4.03 | ||||
| Green | Don Smardon | 529 | 1.14 | – | ||||
| Total valid votes | 46,414 | 100.0 | ||||||
| Progressive Conservative hold | Swing | -0.32 | ||||||
| 1980 Canadian federal election | ||||||||
|---|---|---|---|---|---|---|---|---|
| Party | Candidate | Votes | % | ±% | ||||
| Progressive Conservative | John Allen Fraser | 22,288 | 53.28 | -0.51 | ||||
| Liberal | Patrick F. Graham | 10,254 | 24.51 | -0.56 | ||||
| New Democratic | Judy McManus | 8,896 | 21.27 | +0.36 | ||||
| Rhinoceros | Linda Fleming | 327 | 0.78 | – | ||||
| Marxist–Leninist | Amarjit S. Dhillon | 63 | 0.15 | -0.07 | ||||
| Total valid votes | 41,828 | 100.0 | ||||||
| Progressive Conservative hold | Swing | +0.02 | ||||||
| 1979 Canadian federal election | ||||||||
|---|---|---|---|---|---|---|---|---|
| Party | Candidate | Votes | % | ±% | ||||
| Progressive Conservative | John Allen Fraser | 22,653 | 53.80 | +0.92 | ||||
| Liberal | Tony Toth | 10,558 | 25.07 | -6.50 | ||||
| New Democratic | Judy McManus | 8,806 | 20.91 | +5.83 | ||||
| Marxist–Leninist | Amarjit Dhillon | 91 | 0.22 | +0.04 | ||||
| Total valid votes | 42,108 | 100.0 | ||||||
| Progressive Conservative hold | Swing | +3.71 | ||||||
| 1974 Canadian federal election | ||||||||
|---|---|---|---|---|---|---|---|---|
| Party | Candidate | Votes | % | ±% | ||||
| Progressive Conservative | John Allen Fraser | 23,247 | 52.88 | +12.84 | ||||
| Liberal | Peter Oberlander | 13,881 | 31.57 | -1.22 | ||||
| New Democratic | Roger Howard | 6,629 | 15.08 | -10.04 | ||||
| Communist | James W. Beyon | 129 | 0.29 | – | ||||
| Marxist–Leninist | Anne Boylan | 79 | 0.18 | – | ||||
| Total valid votes | 43,965 | 100.0 | ||||||
| Progressive Conservative hold | Swing | +7.03 | ||||||
| 1972 Canadian federal election | ||||||||
|---|---|---|---|---|---|---|---|---|
| Party | Candidate | Votes | % | ±% | ||||
| Progressive Conservative | John Allen Fraser | 17,762 | 40.03 | +16.29 | ||||
| Liberal | Gordon Gibson | 14,549 | 32.79 | -16.47 | ||||
| New Democratic | Roger Howard | 11,145 | 25.12 | +2.47 | ||||
| Social Credit | Tony Jefferson | 765 | 1.72 | -2.23 | ||||
| Independent | Sean Griffin | 102 | 0.23 | – | ||||
| Independent | Rick Hundal | 44 | 0.10 | – | ||||
| Total valid votes | 44,367 | 100.0 | ||||||
| Progressive Conservative gain from Liberal | Swing | +16.38 | ||||||
| 1968 Canadian federal election | ||||||||
|---|---|---|---|---|---|---|---|---|
| Party | Candidate | Votes | % | ±% | ||||
| Liberal | Arthur Laing | 19,757 | 49.26 | +5.73 | ||||
| Progressive Conservative | John Allen Fraser | 9,521 | 23.74 | +7.70 | ||||
| New Democratic | Joe Warnock | 9,086 | 22.65 | -2.14 | ||||
| Social Credit | Daniel A. Devlin | 1,585 | 3.95 | -10.57 | ||||
| Communist | Robin Smith | 157 | 0.39 | -0.71 | ||||
| Total valid votes | 40,106 | 100.0 | ||||||
| Liberal hold | Swing | -0.98 | ||||||
| 1965 Canadian federal election | ||||||||
|---|---|---|---|---|---|---|---|---|
| Party | Candidate | Votes | % | ±% | ||||
| Liberal | Arthur Laing | 18,669 | 43.54 | -1.53 | ||||
| New Democratic | Norman Levi | 10,633 | 24.80 | +2.08 | ||||
| Progressive Conservative | Mary Southin | 6,877 | 16.04 | -6.04 | ||||
| Social Credit | Norman Howard | 6,228 | 14.52 | +5.20 | ||||
| Communist | William Evans Stewart | 474 | 1.11 | +0.29 | ||||
| Total valid votes | 42,881 | 100.0 | ||||||
| Liberal hold | Swing | -1.80 | ||||||
| 1963 Canadian federal election | ||||||||
|---|---|---|---|---|---|---|---|---|
| Party | Candidate | Votes | % | ±% | ||||
| Liberal | Arthur Laing | 19,140 | 45.07 | +8.63 | ||||
| New Democratic | Cliff Greer | 9,649 | 22.72 | +0.02 | ||||
| Progressive Conservative | J. Ferguson Browne | 9,374 | 22.07 | -7.73 | ||||
| Social Credit | Earl Backman | 3,960 | 9.32 | -0.50 | ||||
| Communist | Thomas A. McEwen | 345 | 0.81 | -0.41 | ||||
| Total valid votes | 42,468 | 100.0 | ||||||
| Liberal hold | Swing | +4.30 | ||||||
| 1962 Canadian federal election | ||||||||
|---|---|---|---|---|---|---|---|---|
| Party | Candidate | Votes | % | ±% | ||||
| Liberal | Arthur Laing | 14,660 | 36.44 | +18.74 | ||||
| Progressive Conservative | Ernest James Broome | 11,990 | 29.81 | -30.65 | ||||
| New Democratic | Cliff Greer | 9,132 | 22.70 | +7.20 | ||||
| Social Credit | Erling L. Backman | 3,953 | 9.83 | +4.64 | ||||
| Communist | William E. Stewart | 492 | 1.22 | +0.08 | ||||
| Total valid votes | 40,227 | 100.0 | ||||||
| Liberal gain from Progressive Conservative | Swing | +24.70 | ||||||
| New Democrate vote is compared to the Co-operative Commonwealth vote and Communist vote is compared to Labor–Progressive vote from 1958 election. | ||||||||
| 1958 Canadian federal election | ||||||||
|---|---|---|---|---|---|---|---|---|
| Party | Candidate | Votes | % | ±% | ||||
| Progressive Conservative | Ernest James Broome | 22,292 | 60.46 | +15.60 | ||||
| Liberal | Elmore Philpott | 6,528 | 17.70 | -3.44 | ||||
| Co-operative Commonwealth | Cliff Greer | 5,717 | 15.50 | +1.96 | ||||
| Social Credit | Hilliard Beyerstein | 1,914 | 5.19 | -12.98 | ||||
| Labor–Progressive | Thomas A. McEwen | 422 | 1.14 | -1.14 | ||||
| Total valid votes | 36,873 | 100.0 | ||||||
| Progressive Conservative hold | Swing | +9.52 | ||||||
| 1957 Canadian federal election | ||||||||
|---|---|---|---|---|---|---|---|---|
| Party | Candidate | Votes | % | ±% | ||||
| Progressive Conservative | Ernest James Broome | 16,058 | 44.86 | +27.41 | ||||
| Liberal | Elmore Philpott | 7,568 | 21.14 | -15.46 | ||||
| Social Credit | Hilliard Beyerstein | 6,505 | 18.17 | -5.16 | ||||
| Co-operative Commonwealth | Cliff Greer | 4,849 | 13.55 | -6.09 | ||||
| Labor–Progressive | Thomas A. McEwen | 817 | 2.28 | -0.70 | ||||
| Total valid votes | 35,797 | 100.0 | ||||||
| Progressive Conservative gain from Liberal | Swing | +21.44 | ||||||
| 1953 Canadian federal election | ||||||||
|---|---|---|---|---|---|---|---|---|
| Party | Candidate | Votes | % | ±% | ||||
| Liberal | Elmore Philpott | 10,459 | 36.60 | -3.11 | ||||
| Social Credit | Ira N. Monson | 6,668 | 23.34 | – | ||||
| Co-operative Commonwealth | Cliff Augustine Greer | 5,610 | 19.63 | -11.93 | ||||
| Progressive Conservative | Lorraine Johnston | 4,986 | 17.45 | -11.28 | ||||
| Labor–Progressive | Gordon Wesley Elder | 852 | 2.98 | – | ||||
| Total valid votes | 28,575 | 100.0 | ||||||
| Liberal hold | Swing | -13.22 | ||||||
| 1949 Canadian federal election | ||||||||
|---|---|---|---|---|---|---|---|---|
| Party | Candidate | Votes | % | ±% | ||||
| Liberal | Arthur Laing | 13,082 | 39.71 | +14.66 | ||||
| Co-operative Commonwealth | Grace MacInnis | 10,397 | 31.56 | +13.90 | ||||
| Progressive Conservative | Jonathan Webster Cornett | 9,462 | 28.72 | -25.06 | ||||
| Total valid votes | 32,941 | 100.0 | ||||||
| Liberal gain from Progressive Conservative | Swing | +0.38 | ||||||
| 1945 Canadian federal election | ||||||||
|---|---|---|---|---|---|---|---|---|
| Party | Candidate | Votes | % | ±% | ||||
| Progressive Conservative | Howard Charles Green | 25,878 | 53.78 | +5.15 | ||||
| Liberal | Richard Rowe Holland | 12,056 | 25.06 | -10.36 | ||||
| Co-operative Commonwealth | Edward Alexander Lucas | 8,497 | 17.66 | +1.70 | ||||
| Democratic | George Rayburn Smith | 920 | 1.91 | – | ||||
| Social Credit | Walter Redvers Dent | 766 | 1.59 | – | ||||
| Total valid votes | 48,117 | 100.0 | ||||||
| Progressive Conservative hold | Swing | +7.76 | ||||||
| Progressive Conservative vote is compared to the National Government vote in 1940 election. | ||||||||
| 1940 Canadian federal election | ||||||||
|---|---|---|---|---|---|---|---|---|
| Party | Candidate | Votes | % | ±% | ||||
| National Government | Howard Charles Green | 18,470 | 48.63 | +17.94 | ||||
| Liberal | Sidney Alexander Smith | 13,451 | 35.41 | +5.63 | ||||
| Co-operative Commonwealth | Arthur James Turner | 6,062 | 15.96 | -11.95 | ||||
| Total valid votes | 37,983 | 100.0 | ||||||
| National Government hold | Swing | +6.16 | ||||||
| National Government vote is compared to Conservative vote in 1935 election. | ||||||||
| 1935 Canadian federal election | ||||||||
|---|---|---|---|---|---|---|---|---|
| Party | Candidate | Votes | % | ±% | ||||
| Conservative | Howard Charles Green | 9,491 | 30.69 | -16.54 | ||||
| Liberal | Alexander Malcolm Manson | 9,212 | 29.78 | – | ||||
| Co-operative Commonwealth | Robert Skinner | 8,632 | 27.91 | – | ||||
| Reconstruction | Archie Bertram Carey | 2,896 | 9.36 | – | ||||
| Independent | Paul McDowell Kerr | 699 | 2.26 | – | ||||
| Total valid votes | 30,930 | 100.0 | ||||||
| Conservative gain from Independent Labour | Swing | -23.16 | ||||||
| 1930 Canadian federal election | ||||||||
|---|---|---|---|---|---|---|---|---|
| Party | Candidate | Votes | % | ±% | ||||
| Independent Labour | Angus MacInnis | 15,732 | 50.03 | +34.58 | ||||
| Conservative | Leon Johnson Ladner | 14,850 | 47.23 | -8.78 | ||||
| Communist | William Bennett | 861 | 2.74 | – | ||||
| Total valid votes | 31,443 | 100.0 | ||||||
| Independent Labour gain from Conservative | Swing | +21.68 | ||||||
| 1926 Canadian federal election | ||||||||
|---|---|---|---|---|---|---|---|---|
| Party | Candidate | Votes | % | ±% | ||||
| Conservative | Leon Johnson Ladner | 9,762 | 56.01 | +8.75 | ||||
| Liberal | Paul McDowell Kerr | 4,973 | 28.53 | -8.88 | ||||
| Labour | Alfred Hurry | 2,693 | 15.45 | +0.13 | ||||
| Total valid votes | 17,428 | 100.0 | ||||||
| Conservative hold | Swing | +8.82 | ||||||
| 1925 Canadian federal election | ||||||||
|---|---|---|---|---|---|---|---|---|
| Party | Candidate | Votes | % | ±% | ||||
| Conservative | Leon Johnson Ladner | 8,587 | 47.27 | +9.52 | ||||
| Liberal | Robert George MacPherson | 6,797 | 37.41 | +5.63 | ||||
| Labour | Alfred Hurry | 2,783 | 15.32 | -6.49 | ||||
| Total valid votes | 18,167 | 100.0 | ||||||
| Conservative hold | Swing | +1.94 | ||||||
| 1921 Canadian federal election | ||||||||
|---|---|---|---|---|---|---|---|---|
| Party | Candidate | Votes | % | ±% | ||||
| Conservative | Leon Johnson Ladner | 4,893 | 37.75 | -27.39 | ||||
| Liberal | Victor Wentworth Odlum | 4,120 | 31.79 | +8.51 | ||||
| Labour | Thomas Richardson | 2,827 | 21.81 | +10.69 | ||||
| Independent | John Kavanagh | 810 | 6.25 | – | ||||
| Progressive | John Isaac Richmond | 312 | 2.41 | – | ||||
| Total valid votes | 12,962 | 100.0 | ||||||
| Conservative hold | Swing | -17.95 | ||||||
| Conservative vote is compared to Unionist vote in 1917 election. | ||||||||
| 1917 Canadian federal election | ||||||||
|---|---|---|---|---|---|---|---|---|
| Party | Candidate | Votes | % | |||||
| Government (Unionist) | Richard Clive Cooper | 6,890 | 65.14 | |||||
| Opposition (Laurier Liberals) | Charles MacDonald | 2,462 | 23.27 | |||||
| Labour | James Hackett McVety | 1,176 | 11.12 | |||||
| Unknown | Edward Gold | 50 | 0.47 | |||||
| Total valid votes | 10,578 | 100.0 | ||||||
| This riding was created from parts of Vancouver City, which elected a Conservative in the previous election. | ||||||||
See also
- List of Canadian federal electoral districts
- Past Canadian electoral districts
References
- "(Code 59034) Census Profile". 2011 census. Statistics Canada. 2012. Retrieved 2011-03-06.
Notes
- Statistics Canada: 2012
- The growing diversity within federal ridings. Policy Options. Retrieved on 2018-19-10.
- Conservative Wai Young beats Dosanjh in rematch. The Globe and Mail. Retrieved on 2014-04-12.
- Vancouver South, CBC.ca, 2008.
- Final Report – British Columbia
- Timeline for the Redistribution of Federal Electoral Districts
- "List of confirmed candidates". Elections Canada. Retrieved October 4, 2019.
- "Election Night Results". Elections Canada. Retrieved November 15, 2019.
- Elections Canada – Confirmed candidates for Vancouver South, 30 September 2015
- Elections Canada – Preliminary Election Expenses Limits for Candidates
- Pundits' Guide to Canadian Elections