1988 Canadian federal election
The 1988 Canadian federal election was held November 21, 1988, to elect members of the House of Commons of Canada of the 34th Parliament of Canada. It was an election largely fought on a single issue: the Canada–United States Free Trade Agreement (FTA).
| |||||||||||||||||||||||||||||||||||||||||||||||||
295 seats in the House of Commons 148 seats needed for a majority | |||||||||||||||||||||||||||||||||||||||||||||||||
|---|---|---|---|---|---|---|---|---|---|---|---|---|---|---|---|---|---|---|---|---|---|---|---|---|---|---|---|---|---|---|---|---|---|---|---|---|---|---|---|---|---|---|---|---|---|---|---|---|---|
| Turnout | 75.3%[1] | ||||||||||||||||||||||||||||||||||||||||||||||||
| |||||||||||||||||||||||||||||||||||||||||||||||||
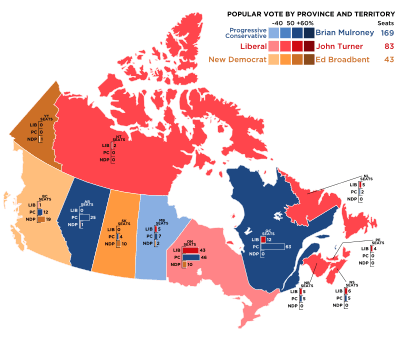 Popular vote by province, with graphs indicating the number of seats won. As this is an FPTP election, seat totals are not determined by popular vote by province but instead via results by each riding. | |||||||||||||||||||||||||||||||||||||||||||||||||
| |||||||||||||||||||||||||||||||||||||||||||||||||
.jpg)
Campaign
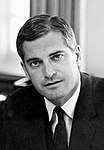
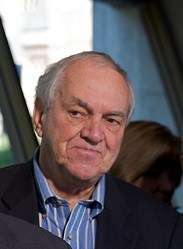
Incumbent Prime Minister Brian Mulroney, leader of the Progressive Conservative Party, had signed the agreement. The Liberal Party, led by John Turner, was opposed to the agreement, as was the New Democratic Party led by Ed Broadbent.
The Progressive Conservatives went into the election suffering from a number of scandals. Despite winning a large majority only four years before, they looked vulnerable at the outset.
The Liberals had some early struggles, notably during one day in Montreal where three different costs were given for the proposed Liberal daycare program. The campaign was also hampered by a Canadian Broadcasting Corporation report that stated there was a movement in the backroom to replace Turner with Jean Chrétien, even though Turner had passed a leadership review in 1986.
Support swung back and forth between the Progressive Conservatives and Liberals over free trade. With mid-campaign polls suggesting a Liberal government, this prompted the Conservatives to stop the relatively calm campaign they had been running, and go with Allan Gregg's suggestion of "bombing the bridge" that joined anti-FTA voters and the Liberals: Turner's credibility. The ads focused on Turner's leadership struggles, and combined with over $6 million CAD in pro-FTA ads, managed to stop the Liberals' momentum.
The Liberals reaped most of the benefits of opposing the FTA and doubled their representation to 83 seats to emerge as the main opposition; the NDP had also made gains but finished a distant third with 43 seats. The Progressive Conservatives won a reduced but strong majority government with 169 seats. Despite the Liberals' improved standing, the results were considered a disappointment for Turner, after polls in mid-campaign predicted a Liberal government. In an ironic reversal of most prior federal elections, the Liberals were kept out of power by their inability to make any headway into the overwhelming Tory majority in Quebec. Indeed, the Liberals actually lost five seats in Quebec, many of which they had only retained in 1984 due to vote-splitting between the Tories and the since-defunct Parti nationaliste du Québec. The election loss sealed Turner's fate; he eventually resigned in 1990, and was succeeded by Jean Chrétien.
Although most Canadians voted for parties opposed to free trade, the Tories were returned with a majority government, and implemented the deal.
Election milestones
Until the 2011 federal election, the 1988 election was the most successful in the New Democratic Party's history. The party dominated in British Columbia and Saskatchewan, won significant support in Ontario and elected its first (and, until the 2008 election, only) member from Alberta.
This was the second election contested by the Green Party, and it saw a more than 50% increase in its vote, but it remained a minor party.
The election was the last for Canada's Social Credit movement: the party won no seats, and had an insignificant portion of the popular vote.
The newly founded Reform Party also contested seats in Western Canada. Reform won no seats and was not considered a major party at the national level. However, Deborah Grey would win the first seat for Reform, Beaver River in Alberta, in a by-election four months later.
For the Progressive Conservatives, this was the last federal election they would ever win.
Opinion polling
The campaign's polling volatility can be seen in the shifting polling averages throughout the campaign.[2] The weekly averages of the campaign, rounded to nearest whole number, were as follows:
| Week | PC | LPC | NDP | Lead |
|---|---|---|---|---|
| Results | 43.0 | 31.9 | 20.4 | 11.1 |
| 7 | 41 | 33 | 22 | 8 |
| 6 | 37 | 37 | 23 | Tie |
| 5 | 37 | 38 | 22 | 1 |
| 4 | 35 | 36 | 26 | 1 |
| 3 | 42 | 27 | 30 | 12 |
| 2 | 43 | 27 | 28 | 15 |
| 1 | 43 | 28 | 26 | 15 |
National results
For a complete list of MPs elected in the 1988 election see 34th Canadian Parliament.
| Party | Party leader | # of candidates |
Seats | Popular vote | ||||||
|---|---|---|---|---|---|---|---|---|---|---|
| 1984 | Dissol. | Elected | % Change | # | % | Change | ||||
| Progressive Conservative | Brian Mulroney | 295 | 211 | 203 | 169 | -19.9% | 5,667,543 | 43.02% | -7.02pp | |
| Liberal | John Turner | 294 | 40 | 38 | 83 | +107.5% | 4,205,072 | 31.92% | +3.89pp | |
| New Democratic Party | Ed Broadbent | 295 | 30 | 32 | 43 | +34.4% | 2,685,263 | 20.38% | +1.57pp | |
| Reform | Preston Manning | 72 | * | - | - | * | 275,767 | 2.09% | * | |
| Christian Heritage | Ed Vanwoudenberg | 63 | * | - | - | * | 102,533 | 0.78% | * | |
| Rhinoceros | Cornelius I | 74 | - | - | - | - | 52,173 | 0.40% | -0.39pp | |
| Green | Seymour Trieger | 68 | - | - | - | - | 47,228 | 0.36% | +0.14pp | |
| Confederation of Regions | Elmer Knutson | 51 | - | - | - | - | 41,342 | 0.31% | -0.68pp | |
| Libertarian | Dennis Corrigan | 88 | - | - | - | - | 33,135 | 0.25% | +0.06pp | |
| No affiliation | 100 | - | - | - | 24,516 | 0.19% | -0.12pp | |||
| Independent | 55 | 1 | 4 | - | - | 22,982 | 0.17% | -0.01pp | ||
| Commonwealth of Canada | Gilles Gervais | 58 | - | - | - | - | 7,467 | 0.06% | -0.21pp | |
| Communist | George Hewison | 51 | - | - | - | - | 7,066 | 0.05% | -0.01pp | |
| Social Credit | Harvey Lainson | 9 | - | - | - | - | 3,407 | 0.03% | -0.10pp | |
| Vacant | 5 | |||||||||
| Total | 1,573 | 282 | 282 | 295 | +4.6% | 13,175,494 | 100% | |||
Note:
"% change" refers to change from previous election
| ↓ | ||||
| 169 | 83 | 43 | ||
| Progressive Conservative | Liberal | NDP | ||
Vote and seat summaries
A number of unregistered parties also contested the election. The Western Canada Concept party, led by Doug Christie, fielded three candidates in British Columbia. The Western Independence Party ran one candidate in British Columbia, seven in Alberta, and three in Manitoba (although one of the Manitoba candidates appears to have withdrawn before election day).
The Liberal candidate in Etobicoke-Lakeshore, Emmanuel Feuerwerker, withdrew from the race after suffering a heart attack, resulting in the Liberals not running a candidate in all 295 ridings during this election.
The Marxist–Leninist Party fielded candidates in several ridings.
Blair T. Longley campaigned in British Columbia as a representative of the "Student Party". Newspaper reports indicate that this was simply a tax-avoidance scheme.
The moribund Social Credit Party fielded nine candidates, far short of the 50 required for official recognition. However, the Chief Electoral Officer allowed the party's name to appear on the ballot by virtue of its half-century history as a recognized party. It would be the last time that the party, which had been the third-largest or fourth-largest party in Canada at its height, would fight an election under its own name. The party was deregistered before the 1993 election after it failed to nominate enough candidates to keep its registration.
Results by province
| Party name | BC | AB | SK | MB | ON | QC | NB | NS | PE | NL | NT | YK | Total | ||
|---|---|---|---|---|---|---|---|---|---|---|---|---|---|---|---|
| Progressive Conservative | Seats: | 12 | 25 | 4 | 7 | 46 | 63 | 5 | 5 | - | 2 | - | - | 169 | |
| Popular Vote: | 35.3 | 51.8 | 36.4 | 36.9 | 38.2 | 52.7 | 40.4 | 40.9 | 41.5 | 42.2 | 26.4 | 35.3 | 43.0 | ||
| Liberal | Seats: | 1 | - | - | 5 | 43 | 12 | 5 | 6 | 4 | 5 | 2 | - | 83 | |
| Vote: | 20.4 | 13.7 | 18.2 | 36.5 | 38.9 | 30.3 | 45.4 | 46.5 | 49.9 | 45.0 | 41.4 | 11.3 | 31.9 | ||
| New Democratic Party | Seats: | 19 | 1 | 10 | 2 | 10 | - | - | - | - | - | - | 1 | 43 | |
| Vote: | 37.0 | 17.4 | 44.2 | 21.3 | 20.1 | 14.4 | 9.3 | 11.4 | 7.5 | 12.4 | 28.3 | 51.4 | 20.38 | ||
| Total seats | 32 | 26 | 14 | 14 | 99 | 75 | 10 | 11 | 4 | 7 | 2 | 1 | 295 | ||
| Parties that won no seats: | |||||||||||||||
| Reform | Vote: | 4.8 | 15.4 | 3.3 | 2.1 | ||||||||||
| Christian Heritage | Vote: | 1.1 | 1.4 | 2.0 | 0.8 | ||||||||||
| Rhinoceros | Vote: | 1.2 | 0.4 | ||||||||||||
| Green | Vote: | 0.4 | |||||||||||||
| Confederation of Regions | Vote: | 4.3 | 0.3 | ||||||||||||
| Libertarian | Vote: | 0.3 | |||||||||||||
| Commonwealth of Canada | Vote: | 0.2 | 0.1 | ||||||||||||
| Communist | Vote: | 0.1 | |||||||||||||
| Social Credit | Vote: | xx | |||||||||||||
| Other | Vote: | 0.4 | |||||||||||||
xx - less than 0.05% of the popular vote.
Note: Parties that captured less than 1% of the vote in a province are not recorded.
Notes
- Number of parties: 11
- First appearance: Christian Heritage Party, Reform Party
- Final appearance: Confederation of Regions Party, Social Credit Party
- Final appearance before hiatus: Communist Party (returned in 2000), Rhinoceros Party (returned in 2006)
10 closest ridings
- London-Middlesex, ON: Terry Clifford (PC) def. Garnet Bloomfield (Lib) by 8 votes
- Northumberland, ON: Christine Stewart (Lib) def. Reg Jewell (PC) by 28 votes
- Hamilton Mountain, ON: Beth Phinney (Lib) def. Marion Dewar (NDP) by 73 votes
- York North, ON: Maurizio Bevilacqua (Lib) def. Michael O'Brien (PC) by 77 votes
- Rosedale, ON: David MacDonald (PC) def. Bill Graham (Lib) by 80 votes
- London East, ON: Joe Fontana (Lib) def. Jim Jepson (PC) by 102 votes
- Haldimand-Norfolk, ON: Bob Speller (Lib) def. Bud Bradley (PC) by 209 votes
- Hillsborough, PE: George Proud (Lib) def. Thomas McMillan (PC) by 259 votes
- Cariboo—Chilcotin, BC: Dave Worthy (PC) def. Jack Langford (NDP) by 269 votes
- Vancouver Centre, BC: future Prime Minister Kim Campbell (PC) def. Johanna Den Hertog (NDP) by 269 votes
See also
- 1911 Canadian federal election, an election similarly contested over free trade with the United States.
- List of Canadian federal general elections
- List of political parties in Canada
Articles on parties' candidates in this election:
- Independents
- Confederation of Regions
- Commonwealth
- Communist
- Green
- Libertarian
- Liberal
- New Democrats
- Progressive Conservative
- Rhinoceros
References
- Pomfret, R. "Voter Turnout at Federal Elections and Referendums". Elections Canada. Elections Canada. Retrieved 11 January 2014.
- Blais, Andre; Boyer, M. Martin (1996). "Assessing the Impact of Televised Debates: The Case of the 1988 Canadian Election". British Journal of Political Science. 26 (2): 143–164. doi:10.1017/S0007123400000405. ISSN 0007-1234. JSTOR 194037.
Further reading
- Argyle, Ray. Turning Points: The Campaigns That Changed Canada - 2011 and Before (2011) excerpt and text search ch 14