Burnaby—New Westminster
Burnaby—New Westminster was a federal electoral district in British Columbia, Canada, that was represented in the House of Commons of Canada from 2004 to 2015.
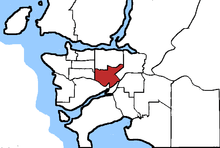 Burnaby—New Westminster in relation to other British Columbia federal electoral districts | |
| Defunct federal electoral district | |
| Legislature | House of Commons |
| District created | 2003 |
| District abolished | 2013 |
| First contested | 2004 |
| Last contested | 2011 |
| District webpage | profile, map |
| Demographics | |
| Population (2011)[1] | 131,917 |
| Electors (2011) | 80,110 |
| Area (km²)[2] | 40.69 |
| Census divisions | Metro Vancouver |
| Census subdivisions | Burnaby, New Westminster |
Demographics
(According to the Canada 2001 Census)
Ethnic groups: 50.7% White, 20.2% Chinese, 10.6% South Asian, 4.3% Filipino, 2.9% Korean, 2.0% Aboriginal, 1.7% Latin American, 1.7% Black, 1.4% Japanese, 1.2% Southeast Asian
Languages: 48.7% English, 1.0% French, 48.0% Other, 2.2% Multiple languages
Religions: 21.1% Protestant, 19.1% Catholic, 6.1% Sikh, 4.6% Muslim, 4.4% Buddhist, 2.9% Christian Orthodox, 1.7% Hindu, 5.7% Other Christian, 33.5% No religious affiliation
Average income: $27,356
Geography
The riding includes all of the City of New Westminster west of 8th Street and all of the city of Burnaby south of the following line: Kingsway to Sussex Avenue to Grange Street to Dover Street to Oakland Street to Sperling Avenue to the Trans-Canada Highway.
History
The riding was created in 2003 from parts of New Westminster—Coquitlam—Burnaby, Vancouver South—Burnaby, and Burnaby—Douglas.
According to the electoral boundaries set out by the 2012 Federal Electoral Boundaries Commission for British Columbia, the riding was dissolved, with various parts joining the new ridings of Burnaby South, New Westminster—Burnaby and Steveston—Richmond East.[3]
Members of Parliament
| Parliament | Years | Member | Party | |
|---|---|---|---|---|
| Riding created from New Westminster—Coquitlam—Burnaby, Vancouver South—Burnaby and Burnaby—Douglas |
||||
| 38th | 2004–2006 | Peter Julian | New Democratic | |
| 39th | 2006–2008 | |||
| 40th | 2008–2011 | |||
| 41st | 2011–2015 | |||
| Riding to be dissolved into Burnaby South, and New Westminster—Burnaby | ||||
Election results
| 2004 Canadian federal election | ||||||||
|---|---|---|---|---|---|---|---|---|
| Party | Candidate | Votes | % | ±% | Expenditures | |||
| New Democratic | Peter Julian | 14,061 | 34.58 | +18.44 | $51,851 | |||
| Liberal | Mary Pynenburg | 13,732 | 32.52 | -0.94 | $67,860 | |||
| Conservative | Mike Redmond | 11,821 | 27.63 | -19.84 | $52,988 | |||
| Green | Revel Kunz | 1,606 | 3.72 | – | $173 | |||
| Canadian Action | Dana Green | 312 | 0.64 | – | $100 | |||
| Communist | Péter Pál Horváth | 166 | 0.26 | – | $389 | |||
| Total valid votes | 41,698 | 100.00 | ||||||
| Total rejected ballots | 217 | 0.52 | ||||||
| Turnout | 41,915 | 58.95 | ||||||
| New Democratic notional gain from Conservative | Swing | +9.69 | ||||||
| This riding was created from parts of New Westminster—Coquitlam—Burnaby, Vancouver South—Burnaby and Burnaby—Douglas, which elected a Canadian Alliance, Liberal and New Democrat, respectively, in the last election. Changes are based on redistributed results. Conservative change based on the total of Canadian Alliance and Progressive Conservative votes in the 2000 election. | ||||||||
| 2006 Canadian federal election | ||||||||
|---|---|---|---|---|---|---|---|---|
| Party | Candidate | Votes | % | ±% | Expenditures | |||
| New Democratic | Peter Julian | 17,391 | 38.79 | +4.21 | $71,414 | |||
| Liberal | Mary Pynenburg | 13,420 | 29.93 | -2.59 | $74,580 | |||
| Conservative | Marc Dalton | 12,364 | 27.58 | -0.05 | $70,006 | |||
| Green | Scott Janzen | 1,654 | 3.68 | -0.04 | $1,149 | |||
| Total valid votes | 44,829 | 100.0 | ||||||
| Total rejected ballots | 144 | 0.32 | -0.20 | |||||
| Turnout | 44,973 | 60.09 | +1.14 | |||||
| New Democratic hold | Swing | +3.40 | ||||||
| 2008 Canadian federal election | ||||||||
|---|---|---|---|---|---|---|---|---|
| Party | Candidate | Votes | % | ±% | Expenditures | |||
| New Democratic | Peter Julian | 20,145 | 46.49 | +7.71 | $72,161 | |||
| Conservative | Sam Rakhra | 13,150 | 30.35 | +2.82 | $77,974 | |||
| Liberal | Gerry Lenoski | 6,681 | 15.42 | -14.53 | $45,125 | |||
| Green | Carrie-Ann McLaren | 3,067 | 7.07 | +3.42 | $7,637 | |||
| Libertarian | Ismet Yetisen | 186 | 0.42 | – | ||||
| Marxist–Leninist | Joseph Theriault | 96 | 0.22 | – | ||||
| Total valid votes/Expense limit | 43,325 | 100.0 | $85,024 | |||||
| Total rejected ballots | 214 | 0.49 | +0.17 | |||||
| Turnout | 43,539 | 54.35 | -5.74 | |||||
| New Democratic hold | Swing | +2.44 | ||||||
| 2011 Canadian federal election | ||||||||
|---|---|---|---|---|---|---|---|---|
| Party | Candidate | Votes | % | ±% | ||||
| New Democratic | Peter Julian | 22,193 | 49.67 | +3.18 | ||||
| Conservative | Paul Forseth | 16,009 | 35.83 | +5.48 | ||||
| Liberal | Garth Evans | 4,496 | 10.06 | -5.36 | ||||
| Green | Carrie-Ann McLaren | 1,731 | 3.87 | -3.20 | ||||
| Libertarian | Tyler Pierce | 160 | 0.36 | -0.06 | ||||
| Marxist–Leninist | Joseph Theriault | 94 | 0.21 | -0.01 | ||||
| Total valid votes | 44,683 | 100.0 | ||||||
| Total rejected ballots | 194 | 0.43 | -0.06 | |||||
| Turnout | 44,877 | 54.05 | -0.30 | |||||
| Eligible voters | 83,029 | |||||||
| New Democratic hold | Swing | -1.15 | ||||||
See also
- List of Canadian federal electoral districts
- Past Canadian electoral districts
References
- "(Code 59003) Census Profile". 2011 census. Statistics Canada. 2012. Retrieved 6 March 2011.
- Library of Parliament Riding Profile
- Expenditures - 2008
- Expenditures - 2004
External links
- Website of the Parliament of Canada
- Map of riding archived by Elections Canada