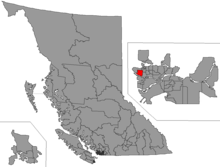
Vancouver-Quilchena
Vancouver-Quilchena is a provincial electoral district for the Legislative Assembly of British Columbia, Canada. According to the 2006 Census, this riding is the second-wealthiest in British Columbia with an average family income of $91,822, behind West Vancouver-Capilano just across the Burrard Inlet.[1]
 | |||
| Provincial electoral district | |||
| Legislature | Legislative Assembly of British Columbia | ||
| MLA |
Liberal | ||
Demographics
| Population | 54,709 |
| Population Change, 1996–2001 | 2.5% |
| Area (km²) | 21.48 |
| Pop. Density (people per km²) | 2,547 |
Geography
History
Members of the Legislative Assembly
| Assembly | Years | Member | Party | |
|---|---|---|---|---|
| 35th | 1991–1993 | Art Cowie | Liberal | |
| 1993–1996 | Gordon Campbell | |||
| 36th | 1996–2001 | Colin Hansen | ||
| 37th | 2001–2005 | |||
| 38th | 2005–2008 | |||
| 39th | 2009–2013 | |||
| 40th | 2013–2017 | Andrew Wilkinson | ||
| 41st | 2017–present | |||
Election results
| 2017 British Columbia general election | ||||||||
|---|---|---|---|---|---|---|---|---|
| Party | Candidate | Votes | % | |||||
| Liberal | Andrew Wilkinson | 12,464 | 55.96 | |||||
| New Democratic | Madeline Lalonde | 6,244 | 28.03 | |||||
| Green | Michael Barkusky | 3,301 | 14.82 | |||||
| Libertarian | William Morrison | 265 | 1.19 | |||||
| Total valid votes | 22,274 | 100.00 | ||||||
| Total rejected ballots | 116 | |||||||
| Turnout | 22,390 | |||||||
| Source: Elections BC[2] | ||||||||
| 2013 British Columbia general election | ||||||||
|---|---|---|---|---|---|---|---|---|
| Party | Candidate | Votes | % | |||||
| Liberal | Andrew Wilkinson | 14,496 | 64.32 | |||||
| New Democratic | Nicholas Scapillati | 5,705 | 25.31 | |||||
| Green | Damian Kettlewell | 1,667 | 7.40 | |||||
| No Affiliation | Bill Clarke | 671 | 2.98 | |||||
| Total valid votes | 22,539 | 100.00 | ||||||
| Total rejected ballots | 108 | 0.48 | ||||||
| Turnout | 22,647 | 59.45 | ||||||
| Source: Elections BC[3] | ||||||||
| Party | Candidate | Votes | % | ± | Expenditures | |
|---|---|---|---|---|---|---|
| Liberal | Colin Hansen | 15,731 | 70.22 | +3.06 | $109,703 | |
| New Democratic | James Young | 4,646 | 20.74 | -0.28 | $12,514 | |
| Green | Laura-Leah Shaw | 2,024 | 9.04 | -1.36 | $1,837 | |
| Total valid votes | 22,401 | 100 | ||||
| Total rejected ballots | 127 | 0.56 | ||||
| Turnout | 22,528 | 57.67 | ||||
| Party | Candidate | Votes | % | ± | Expenditures | |
|---|---|---|---|---|---|---|
| Liberal | Colin Hansen | 16,394 | 67.16 | – | $107,414 | |
| NDP | Jarrah Hodge | 5,131 | 21.02 | $13,103 | ||
| Green | Lorinda Earl | 2,538 | 10.40 | – | $2,633 | |
| Marijuana | Rhiannon Rose | 175 | 0.72 | $100 | ||
| Libertarian | Katrina Chowne | 174 | 0.71 | $100 | ||
| Total valid votes | 24,412 | 100 | ||||
| Total rejected ballots | 128 | 0.52 | ||||
| Turnout | 24,540 | 61.64 | ||||
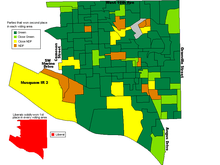
Popular vote by voting area in the 2001 election
| Party | Candidate | Votes | % | ± | Expenditures | |
|---|---|---|---|---|---|---|
| Liberal | Colin Hansen | 16,829 | 73.86% | – | $34,886 | |
| Green | Judy Johnstone | 3,277 | 14.38% | – | $360 | |
| NDP | Gareth Charles Richmond | 2,168 | 9.52% | $6,725 | ||
| Marijuana | Katrina Chowne | 351 | 1.54% | $394 | ||
| Independent | Mike Sharp | 160 | 0.70% | |||
| Total valid votes | 22,785 | 100.00% | ||||
| Total rejected ballots | 96 | 0.42% | ||||
| Turnout | 22,881 | 73.44% | ||||
| Party | Candidate | Votes | % | ± | Expenditures | |
|---|---|---|---|---|---|---|
| Liberal | Colin Hansen | 15,509 | 68.68% | – | $36,863 | |
| NDP | Roger Boshier | 4,977 | 22.04% | $13,802 | ||
| Progressive Democrat | Richard Chave Sanderson | 827 | 3.66% | – | $300 | |
| Green | Valerie Jerome | 627 | 2.78% | – | $459 | |
| Reform | Jay Davison | 495 | 2.19% | – | $975 | |
| Social Credit | Lorraine Hinton | 91 | 0.40% | – | $2,142 | |
| Natural Law | Alan Mackenzie Brooke | 57 | 0.25% | $134 | ||
| Total valid votes | 22,583 | 100.00% | ||||
| Total rejected ballots | 109 | 0.48% | ||||
| Turnout | 22,692 | 75.71% | ||||
| Party | Candidate | Votes | % | ± | Expenditures | |
|---|---|---|---|---|---|---|
| Liberal | Art Cowie | 11,373 | 49.53% | – | $56,984 | |
| NDP | Stuart P. Hertzog | 6,172 | 26.88% | $14,576 | ||
| Social Credit | Doug Mowat | 5,113 | 22.27% | – | $64,574 | |
| Green | Valerie E. Parker | 302 | 1.32% | – | $809 | |
| Total valid votes | 22,960 | 100.00% | ||||
| Total rejected ballots | 309 | 1.33% | ||||
| Turnout | 23,269 | 80.40% | ||||
gollark: You can type "DS" easily.
gollark: Also "DS".
gollark: Phones are, in my experience, pretty sturdy, glasses are not and will randomly break under any stress.
gollark: It's kind of annoying, but I'm trying to avoid actually getting glasses for it as long as possible because they would be *so* annoying to manage.
gollark: Apparently I'm somewhat short-sighted, which might be because I use computers all the time and might be genetic or something.
References
- https://vancouversun.com/news/bc-election/Rich+ridings+lean+Liberal+poor+ridings+British+Columbia/8307309/story.html
- "2017 Provincial General Election Preliminary Voting Results". Elections BC. Retrieved 11 May 2017.
- "Statement of Votes - 40th Provincial General Election" (PDF). Elections BC. Retrieved 17 May 2017.
External links
This article is issued from Wikipedia. The text is licensed under Creative Commons - Attribution - Sharealike. Additional terms may apply for the media files.