Surrey-Cloverdale
Surrey-Cloverdale is a provincial electoral district for the Legislative Assembly of British Columbia, Canada.
 | |||
| Provincial electoral district | |||
| Legislature | Legislative Assembly of British Columbia | ||
| MLA |
Liberal | ||
| Demographics | |||
| Population (2001) | 49,122 | ||
| Area (km²) | 144 | ||
| Pop. density (per km²) | 341.1 | ||
| Census divisions | Metro Vancouver | ||
| Census subdivisions | Surrey | ||
Demographics
| Population, 2001 | 49,122 |
| Population Change, 1996–2001 | 19.2% |
| Area (km²) | 144 |
| Pop. Density (people per km²) | 341 |
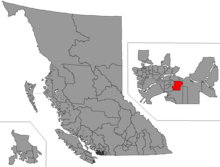
Geography
1999 Redistribution
Changes to Surrey-Cloverdale include
- removal of northwestern-most half to Surrey-Tynehead
- inclusion of a western panhandle from Surrey-Newton
History
| Assembly | Years | Member | Party | |
|---|---|---|---|---|
| 35th | 1991–1996 | Ken Jones | Liberal | |
| 36th | 1996–2001 | Bonnie McKinnon | ||
| 2001 | Independent | |||
| 37th | 2001–2005 | Ken Jones | Liberal | |
| 38th | 2005–2009 | |||
| 39th | 2009–2013 | |||
| 40th | 2013–2017 | Stephanie Cadieux | ||
| 41st | 2017–present | Marvin Hunt | ||
Member of Legislative Assembly
Its MLA is Marvin Hunt, who represents the British Columbia Liberal Party.
Election results
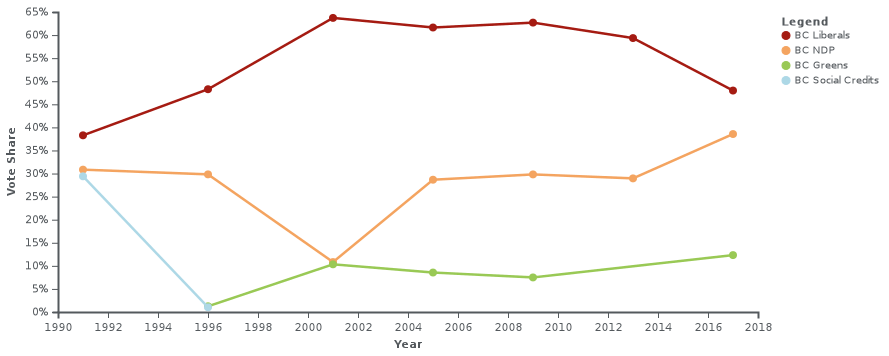
Graph of provincial election results in Surrey-Cloverdale (minor parties that never got 2% of the vote or didn't run consistently are omitted).
| 2017 British Columbia general election | ||||||||
|---|---|---|---|---|---|---|---|---|
| Party | Candidate | Votes | % | |||||
| Liberal | Marvin Hunt | 11,171 | 47.98 | |||||
| New Democratic | Rebecca Smith | 8,976 | 38.56 | |||||
| Green | Aleksandra Muniak | 2,871 | 12.33 | |||||
| Libertarian | Peter Poelstra | 263 | 1.13 | |||||
| Total valid votes | 23,281 | 100.00 | ||||||
| Source: Elections BC[1] | ||||||||
| 2013 British Columbia general election | ||||||||
|---|---|---|---|---|---|---|---|---|
| Party | Candidate | Votes | % | ±% | Expenditures | |||
| Liberal | Stephanie Cadieux | 18,051 | 59.53 | -3.17 | $86,812 | |||
| New Democratic | Harry Kooner | 8,777 | 28.95 | -0.86 | $54,929 | |||
| Conservative | Howard Wu | 2,545 | 8.39 | $852 | ||||
| No Affiliation | Matt William Begley | 949 | 3.13 | $750 | ||||
| Total valid votes | 30,322 | 100.00 | ||||||
| Total rejected ballots | 202 | 0.66 | ||||||
| Turnout | 30,524 | 57.79 | ||||||
| Source: Elections BC[2] | ||||||||
| 2009 British Columbia general election | ||||||||
|---|---|---|---|---|---|---|---|---|
| Party | Candidate | Votes | % | ±% | ||||
| Liberal | Kevin Falcon | 13,815 | 62.70 | 1.06 | ||||
| New Democratic | Deborah Payment | 6,567 | 29.81 | +1.15 | ||||
| Green | Kevin Purton | 1,651 | 7.49 | −1.06 | ||||
| Total | 22,033 | 100.00 | ||||||
| 2005 British Columbia general election | ||||||||
|---|---|---|---|---|---|---|---|---|
| Party | Candidate | Votes | % | ±% | ||||
| Liberal | Kevin Falcon | 16,429 | 61.64 | −2.08 | ||||
| New Democratic | Ted Allen | 7,640 | 28.66 | +18.33 | ||||
| Green | Pierre Rovtar | 2,280 | 8.55 | −1.78 | ||||
| Democratic Reform | Joseph Vollhoffer | 305 | 1.14 | – | ||||
| Total | 26,654 | 100.00 | ||||||
| Party | Candidate | Votes | % | ± | Expenditures | |
|---|---|---|---|---|---|---|
| Liberal | Kevin Falcon | 13,739 | 63.72% | +15.45% | $47,532 | |
| NDP | Steve Oakley | 2,333 | 10.82% | -19.00% | $11,172 | |
| Green | Steve Chitty | 2,227 | 10.33% | +9.09% | $463 | |
| Independent | Bonnie McKinnon | 1,669 | 7.74% | n/a | $6,828 | |
| Unity | George Hoytema | 1,112 | 5.16% | n/a | $4,774 | |
| Marijuana | Jason Elliott | 481 | 2.23% | n/a | $394 | |
| Total valid votes | 21,561 | 100.00% | ||||
| Total rejected ballots | 82 | 0.38% | ||||
| Turnout | 21,643 | 75.45% | ||||
| Party | Candidate | Votes | % | ± | Expenditures | |
|---|---|---|---|---|---|---|
| Liberal | Bonnie McKinnon | 14,297 | 48.27% | +9.99% | $44,135 | |
| NDP | Charan Gill | 8,831 | 29.82% | -1.02% | $45,783 | |
| Reform | Stuart Clark | 2,690 | 9.08% | n/a | $8,429 | |
| Progressive Democrat | Philip McCormack | 2,417 | 8.16% | n/a | $839 | |
| Green | David Walters | 366 | 1.24% | n/a | $790 | |
| Family Coalition | Heather Stilwell | 98 | 0.52% | -0.59% | $3,584 | |
| Social Credit | Bill Gall | 306 | 1.03% | -28.37% | $8,044 | |
| Total valid votes | 29,616 | 100.00% | ||||
| Total rejected ballots | 214 | 0.72% | ||||
| Turnout | 29,830 | 74.75% | ||||
| Party | Candidate | Votes | % | ± | Expenditures | |
|---|---|---|---|---|---|---|
| Liberal | Ken Jones | 9,012 | 38.28% | $12,624 | ||
| NDP | Charan Gill | 7,261 | 30.84% | $30,517 | ||
| Social Credit | Judy Higginbotham | 6,920 | 29.40% | $64,823 | ||
| Family Coalition | John P. Onderwater | 260 | 1.11% | $1,434 | ||
| Libertarian | Eric Smith | 88 | 0.37% | |||
| Total valid votes | 23,541 | 100.00% | ||||
| Total rejected ballots | 430 | 1.79% | ||||
| Turnout | 23,971 | 78.69% | ||||
gollark: https://internals.rust-lang.org/t/0-1-0-2-0-30000000000000004-a-cliche-question/14695
gollark: It only seems to be on some servers.
gollark: It is too late. Discord has "threads".
gollark: `macro match x(apio)` somehow?
gollark: `declmacron`?
References
- "2017 Provincial General Election Preliminary Voting Results". Elections BC. Retrieved 11 May 2017.
- "Statement of Votes - 40th Provincial General Election" (PDF). Elections BC. Retrieved 17 May 2017.
External links
This article is issued from Wikipedia. The text is licensed under Creative Commons - Attribution - Sharealike. Additional terms may apply for the media files.