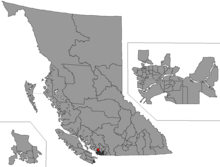
North Vancouver-Seymour
North Vancouver-Seymour is a provincial electoral district for the Legislative Assembly of British Columbia, Canada.
 | |||
| Provincial electoral district | |||
| Legislature | Legislative Assembly of British Columbia | ||
| MLA |
Liberal | ||
For other current and historical North Shore and City of Vancouver ridings, please see Vancouver (electoral districts)
Demographics
| Population, 2001 | 54,404 |
| Population Change, 1996–2001 | 2.3% |
| Area (km²) | 360 |
| Pop. Density (people per km²) | 151 |
Geography
History
Its MLA is Jane Thornthwaite. She was first elected in 2009 and was re-elected in 2013 and 2017.
| Parliament | Years | Member | Party | |
|---|---|---|---|---|
| 31st | 1975-1979 | Jack Davis | Social Credit | |
| 32nd | 1979-1983 | |||
| 33rd | 1983-1986 | |||
| 34th | 1986-1991 | |||
| 35th | 1991–1996 | Daniel Jarvis | Liberal | |
| 36th | 1996–2001 | |||
| 37th | 2001–2005 | |||
| 38th | 2005–2009 | |||
| 39th | 2009–2013 | Jane Thornthwaite | Liberal | |
| 40th | 2013–2017 | |||
| 41st | 2017–present | |||
Election results
| 2017 British Columbia general election | ||||||||
|---|---|---|---|---|---|---|---|---|
| Party | Candidate | Votes | % | |||||
| Liberal | Jane Thornthwaite | 13,194 | 46.36 | |||||
| New Democratic | Michael Rene Charrois | 9,808 | 34.47 | |||||
| Green | Joshua Johnson | 5,208 | 18.30 | |||||
| Libertarian | Clayton Welwood | 247 | 0.87 | |||||
| Total valid votes | 28,457 | 100.00 | ||||||
| Source: Elections BC[1] | ||||||||
| 2013 British Columbia general election | ||||||||
|---|---|---|---|---|---|---|---|---|
| Party | Candidate | Votes | % | ±% | Expenditures | |||
| Liberal | Jane Thornthwaite | 13,186 | 50.92 | –8.26 | $111,404 | |||
| New Democratic | Jim Hanson | 8,524 | 32.92 | +5.54 | $86,982 | |||
| Green | Daniel Scott Smith | 1,897 | 7.33 | –2.01 | $350 | |||
| Conservative | Brian R. Wilson | 1,206 | 4.66 | +0.56 | $9,255 | |||
| Independent | Jaime Alexandra Webbe | 1,081 | 4.17 | – | $3,800 | |||
| Total valid votes | 25,894 | 100.00 | ||||||
| Total rejected ballots | 89 | 0.34 | ||||||
| Turnout | 25,983 | 66.99 | ||||||
| Source: Elections BC[2] | ||||||||
| Party | Candidate | Votes | % | ± | Expenditures | |
|---|---|---|---|---|---|---|
| Liberal | Jane Thornthwaite | 13,426 | 59.18 | $57,237 | ||
| New Democratic | Maureen Norton | 6,212 | 27.38 | $17,589 | ||
| Green | Daniel Quinn | 2,116 | 9.34 | – | $350 | |
| Conservative | Gary Bickling Hee | 931 | 4.10 | $1,186 | ||
| Total valid votes | 22,685 | 100% | ||||
| Total rejected ballots | 100 | 0.44% | ||||
| Turnout | 22,785 | 61.46% | ||||
| Party | Candidate | Votes | % | ± | Expenditures | |
|---|---|---|---|---|---|---|
| Liberal | Daniel Jarvis | 14,518 | 56.92% | $55,591 | ||
| NDP | Cathy Pinsent | 7,595 | 29.78% | $18,913 | ||
| Green | John Sharpe | 3,013 | 11.81% | – | $1,960 | |
| Marijuana | Darin Keith Neal | 212 | 0.83% | $100 | ||
| Work Less | Christine E. Ellis | 169 | 0.66% | – | $100 | |
| Total valid votes | 25,507 | 100% | ||||
| Total rejected ballots | 110 | 0.43% | ||||
| Turnout | 25,617 | 74.88% | ||||
| Party | Candidate | Votes | % | ± | Expenditures | |
|---|---|---|---|---|---|---|
| Liberal | Daniel Jarvis | 15,568 | 65.12% | $26,212 | ||
| Green | Evelyn Kirkaldy | 4,127 | 17.26% | – | $590 | |
| NDP | Sheila Paterson | 2,751 | 11.51% | $4,981 | ||
| Reform | Ron Gamble | 683 | 2.86% | $6,822 | ||
| Marijuana | Tom Dreyer | 568 | 2.38% | $721 | ||
| Independent | Chris McKenzie | 209 | 0.87% | $250 | ||
| Total valid votes | 23,906 | 100.00% | ||||
| Total rejected ballots | 94 | 0.39% | ||||
| Turnout | 24,000 | 73.72% | ||||
| Party | Candidate | Votes | % | ± | Expenditures | |
|---|---|---|---|---|---|---|
| Liberal | Daniel Jarvis | 14,165 | 56.35% | $26,245 | ||
| NDP | Michelle Kemper | 6,676 | 26.56% | $14,030 | ||
| Reform | Caroline Meredith | 1,737 | 6.91% | $15,297 | ||
| Progressive Democrat | David Massey | 1,713 | 6.81% | – | $2,059 | |
| Green | Mark Brooks | 645 | 2.57% | – | $324 | |
| Social Credit | Jonn R. Kunickey | 105 | 0.42% | – | $8,221 | |
| Libertarian | Bill Tomlinson | 54 | 0.21% | $100 | ||
| Natural Law | Deborah Rubin | 44 | 0.18% | $133 | ||
| Total valid votes | 25,139 | 100.00% | ||||
| Total rejected ballots | 85 | 0.34% | ||||
| Turnout | 25,224 | 76.63% | ||||
| Party | Candidate | Votes | % | ± | Expenditures | |
|---|---|---|---|---|---|---|
| Liberal | Daniel Jarvis | 12,120 | 50.84% | $12,138 | ||
| NDP | Dominique Roelants | 7,126 | 29.89% | $25,273 | ||
| Social Credit | Gordon Frampton | 4,304 | 18.06% | – | $22,050 | |
| Green | Donald Rennie | 205 | 0.86% | – | ||
| Libertarian | Bill Tomlinson | 84 | 0.35% | |||
| Total valid votes | 23,839 | 100.00% | ||||
| Total rejected ballots | 283 | 1.17% | ||||
| Turnout | 24,122 | 79.49% | ||||
gollark: rpg play bee noises 1 hour
gollark: !play bee noises 1 hour
gollark: π
gollark: c?help
gollark: <@463070571328962562>
External links
- BC Stats Profile - 2001 (pdf)
- Results of 2001 election (pdf)
- 2001 Expenditures
- Results of 1996 election
- 1996 Expenditures
- Results of 1991 election
- 1991 Expenditures
- Website of the Legislative Assembly of British Columbia
- "2017 Provincial General Election Preliminary Voting Results". Elections BC. Retrieved 11 May 2017.
- "Statement of Votes - 40th Provincial General Election" (PDF). Elections BC. Retrieved 17 May 2017.
This article is issued from Wikipedia. The text is licensed under Creative Commons - Attribution - Sharealike. Additional terms may apply for the media files.