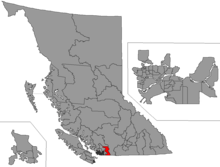
Chilliwack-Kent
Chilliwack-Kent is a provincial electoral district for the Legislative Assembly of British Columbia, Canada that first existed from 2001 to 2009, when it was replaced by the Chilliwack-Hope riding. In the 2015 redistribution, the eastern portion of Chilliwack-Hope was adjusted and the name Chilliwack-Kent was brought back into service and was contested in the 2017 general election.
 | |||
| Provincial electoral district | |||
| Legislature | Legislative Assembly of British Columbia | ||
| MLA |
Liberal | ||
Demographics[1]
| Population, 2014 | 51,021 |
| Area (km²) | 3,168 |
Geography
1999 Redistribution
Changes from Chilliwack to Chilliwack-Kent include:
History
| Assembly | Years | Member | Party | |
|---|---|---|---|---|
| Chilliwack-Kent | ||||
| 37th | 2001–2005 | Barry Penner | Liberal | |
| 38th | 2005–2009 | |||
| Chilliwack-Hope | ||||
| 39th | 2009–2011 | Barry Penner | Liberal | |
| 2011–2013 | Gwen O'Mahony | New Democratic | ||
| 40th | 2013–2017 | Laurie Throness | Liberal | |
| Chilliwack-Kent | ||||
| 41st | 2017–present | Laurie Throness | Liberal | |
Member of Legislative Assembly
As of the 2017 election, its MLA is Laurie Throness, who was first elected to represent the Chilliwack-Hope riding in 2013. From 2001 to 2009, Chilliwack-Kent was represented by Barry Penner.[2]
Election results
| 2017 British Columbia general election | ||||||||
|---|---|---|---|---|---|---|---|---|
| Party | Candidate | Votes | % | Expenditures | ||||
| Liberal | Laurie Throness | 11,841 | 52.75 | $38,776 | ||||
| New Democratic | Patti MacAhonic | 7,273 | 32.40 | $25,581 | ||||
| Green | Josie Bleuer | 3,335 | 14.85 | $62 | ||||
| Total valid votes | 22,449 | 100.00 | ||||||
| Total rejected ballots | 145 | 0.64 | ||||||
| Turnout | 22,594 | 59.55 | ||||||
| Source: Elections BC[3] | ||||||||
| 2005 British Columbia general election | ||||||||
|---|---|---|---|---|---|---|---|---|
| Party | Candidate | Votes | % | Expenditures | ||||
| Liberal | Barry Penner | 11,368 | 57.14 | $77,840 | ||||
| New Democratic | Malcolm James | 6,534 | 32.84 | $16,280 | ||||
| Green | Hans Mulder | 1,651 | 8.30 | $1,742 | ||||
| Moderates | David Michael Anderson | 240 | 1.21 | $120 | ||||
| Youth Coalition | Colin Wormworth | 103 | 0.52 | $100 | ||||
| Total Valid Votes | 19,896 | 100 | ||||||
| Total Rejected Ballots | 118 | 0.59 | ||||||
| Turnout | 20,014 | 58.71 | ||||||
| Party | Candidate | Votes | % | ± | Expenditures | |
|---|---|---|---|---|---|---|
| Liberal | Barry Penner | 13,814 | 74.88% | $40,938 | ||
| NDP | Malcolm James | 2,155 | 11.68% | $3,979 | ||
| Green | Larry Commodore | 1,511 | 8.19% | – | $890 | |
| Marijuana | David Ferguson | 968 | 5.25% | $1,496 | ||
| Total valid votes | 18,448 | 100.00% | ||||
| Total rejected ballots | 94 | 0.51% | ||||
| Turnout | 18,542 | 71.63% | ||||
gollark: We have 0.1 chance if we do not get 25.
gollark: * ESobot
gollark: Esolangs is public and it can run on ABR's servers.
gollark: "Deposed Tyrant"?
gollark: Er, probably moved.
External links
References
- bc-ebc.ca/docs/BC-EBC Population of Proposed Electoral Districts.pdf
- "Chilliwack-Hope B.C. Votes". CBC.ca. Retrieved 2009-04-12.
- "Statement of Votes – 41st Provincial General Election – May 9, 2017" (PDF). Elections BC. Retrieved December 7, 2019.
This article is issued from Wikipedia. The text is licensed under Creative Commons - Attribution - Sharealike. Additional terms may apply for the media files.