Burnaby-Edmonds
Burnaby-Edmonds is a provincial electoral district for the Legislative Assembly of British Columbia, Canada.
 | |||
| Provincial electoral district | |||
| Legislature | Legislative Assembly of British Columbia | ||
| MLA |
New Democratic | ||
Demographics
| Population | 55,741 |
| Population Change, 1996–2001 | 11.7% |
| Area (km²) | 25.48 |
| Pop. Density (people per km²) | 2,188 |
Geography
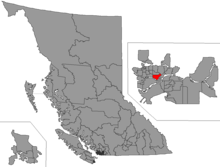
The district is located in southern Burnaby, British Columbia. It is bordered by Boundary Road to the east, Imperial and Mayfield Streets to the north, 4th Street to the east, and 10th Avenue and Fraser River to the south.
History
Electoral History
| Members of the Legislative Assembly for Burnaby-Edmonds | ||||
|---|---|---|---|---|
| Parliament | Years | Member | Party | |
| 35th | 1991-1996 | Fred G. Randall | NDP | |
| 36th | 1996-2001 | |||
| 37th | 2001–2005 | Patty Sahota | Liberal | |
| 38th | 2005–2009 | Raj Chouhan | NDP | |
| 39th | 2009–2013 | |||
| 40th | 2013–2017 | |||
| 41st | 2017–present | |||
Election results
| 2017 British Columbia general election | ||||||||
|---|---|---|---|---|---|---|---|---|
| Party | Candidate | Votes | % | ±% | Expenditures | |||
| New Democratic | Raj Chouhan | 10,827 | 54.25 | +2.82 | ||||
| Liberal | Garrison Duke | 6,404 | 32.08 | -6.55 | ||||
| Green | Valentine Wu | 2,728 | 13.67 | +4.93 | ||||
| Total valid votes | 19,959 | 100.0 | ||||||
| Total rejected ballots | 156 | |||||||
| Turnout | 20,115 | 53.8 | ||||||
| 2013 British Columbia general election | ||||||||
|---|---|---|---|---|---|---|---|---|
| Party | Candidate | Votes | % | ±% | Expenditures | |||
| New Democratic | Raj Chouhan | 9,253 | 51.43 | -0.51% | $79,346 | |||
| Liberal | Jeff Kuah | 6,950 | 38.63 | +0.27% | $20,696 | |||
| Green | Wyatt Tessari | 1,573 | 8.74 | +2.00% | $600 | |||
| Excalibur | Nicholas Edward D'Amico | 215 | 1.20 | - | $341 | |||
| Total valid votes | 17,991 | 100.00 | ||||||
| Total rejected ballots | 203 | 1.12 | ||||||
| Turnout | 18,194 | 49.00 | ||||||
| Source: Elections BC[1] | ||||||||
| Party | Candidate | Votes | % | ± | Expenditures | |
|---|---|---|---|---|---|---|
| New Democratic | Raj Chouhan | 8,647 | 51.94% | +20.52% | $75,002 | |
| BC Liberal | Lee Rankin | 6,385 | 38.36% | -7.71% | $80,469 | |
| Green | Carrie McLaren | 1,122 | 6.74% | -3.17% | $383 | |
| Libertarian | Dan Cancade | 493 | 2.96% | +2.96% | $643 | |
| Total valid votes | 16,647 | 100% | ||||
| Total rejected ballots | 178 | 1.06% | ||||
| Turnout | 16,825 | 49.07% | ||||
| Party | Candidate | Votes | % | ± | Expenditures | |
|---|---|---|---|---|---|---|
| NDP | Raj Chouhan | 10,337 | 46.71% | +5.23% | $71,644 | |
| BC Liberal | Patty Sahota | 9,599 | 43.38% | -5.02% | $109,119 | |
| Green | Suzanne Deveau | 2,192 | 9.91% | – | $1,754 | |
| Total valid votes | 22,128 | 100% | ||||
| Total rejected ballots | 155 | 0.70% | ||||
| Turnout | 22,283 | 57.70% | ||||
| 2001 British Columbia general election | ||||||||
|---|---|---|---|---|---|---|---|---|
| Party | Candidate | Votes | % | Expenditures | ||||
| Liberal | Patty Sahota | 9,607 | 51.09 | $34,249 | ||||
| New Democratic | Sav Dhaliwal | 4,924 | 26.19 | $48,520 | ||||
| Green | Eric Hawthorne | 2,599 | 13.82 | $2,231 | ||||
| Unity | Grant Murray | 1,111 | 5.91 | $7,646 | ||||
| Marijuana | Roy Arjun | 456 | 2.43 | $394 | ||||
| Citizens | Gordon S. Watson | 105 | 0.56 | $1,150 | ||||
| Total valid votes | 18,802 | 100.00 | ||||||
| Total rejected ballots | 120 | 0.64 | ||||||
| Turnout | 18,922 | 69.90 | ||||||
| Party | Candidate | Votes | % | ± | Expenditures | |
|---|---|---|---|---|---|---|
| NDP | Fred G. Randall | 9,912 | 46.45% | -0.70% | $41,298 | |
| BC Liberal | Judy St. Denis | 8,770 | 41.09% | -8.39% | $52,980 | |
| Progressive Democrat | John Schwermer | 1,067 | 5.00% | – | $200 | |
| Reform | Carlos Brito | 1,008 | 4.72% | $1,921 | ||
| Green | Eric Hawthorne | 387 | 1.81% | – | $655 | |
| Social Credit | Suraj Narain | 120 | 0.56% | – | ||
| Natural Law | Guy Harvey | 77 | 0.36% | $136 | ||
| Total valid votes | 21,341 | 100.00% | ||||
| Total rejected ballots | 172 | 0.80% | ||||
| Turnout | 21,513 | 70.63% | ||||
| Party | Candidate | Votes | % | ± | Expenditures | |
|---|---|---|---|---|---|---|
| NDP | Fred G. Randall | 9,947 | 47.15% | $75,824 | ||
| BC Liberal | Carlos A. Brito | 6,898 | 32.70% | $4,470 | ||
| Social Credit | Peter M. Wearing | 3,900 | 18.49% | – | $33,816 | |
| Green | Elizabeth D. Smith | 199 | 0.94% | – | $100 | |
| Conservative | Debra J. A. Hicks | 77 | 0.37% | $40 | ||
| Independent | Kurt Gruen | 74 | 0.35% | $2,386 | ||
| Total valid votes | 21,095 | 100.00% | ||||
| Total rejected ballots | 544 | 2.51% | ||||
| Turnout | 21,639 | 72.71% | ||||
gollark: Regular wired ones are, what, *£5*?!
gollark: REASONABLY PRICED?!
gollark: Great, I should pay money for an inferior solution!
gollark: Er, not might, inevitably will.
gollark: Another thing which increases cost and which I might løse!
External links
- Statement of Votes, 40th BC General Election
- BC Stats
- Map of electoral district after 2008 redistribution
- Results of 2001 election (pdf)
- 2001 Expenditures (pdf)
- Results of 1996 election
- 1996 Expenditures
- Results of 1991 election
- 1991 Expenditures
- Website of the Legislative Assembly of British Columbia
- "Statement of Votes - 40th Provincial General Election" (PDF). Elections BC. Retrieved 17 May 2017.
This article is issued from Wikipedia. The text is licensed under Creative Commons - Attribution - Sharealike. Additional terms may apply for the media files.