Nanaimo (provincial electoral district)
Nanaimo is a provincial electoral district for the Legislative Assembly of British Columbia, Canada.
 | |||
| Provincial electoral district | |||
| Legislature | Legislative Assembly of British Columbia | ||
| MLA |
New Democratic | ||
| Demographics | |||
| Census divisions | Nanaimo Regional District | ||
| Census subdivisions | Nanaimo, Nanaimo C | ||
Demographics
| Population, 2011[1] | 57,008 |
| Area (km²) | 458 |
| Pop. Density (people per km²) | 124.5 |
Geography
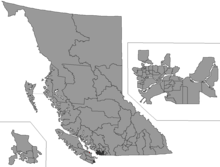
The riding contains most of the city of Nanaimo plus the uninhabited Five Finger Island, Snake Island and Hudson Rocks which are in the Nanaimo C electoral area.
History
The district was known as Nanaimo and the Islands from 1941 to 1963. It was formed of parts of the former ridings of Alberni-Nanaimo and The Islands. In the 1966 election the Nanaimo riding name was restored and the southern part of the riding became Saanich and the Islands. That area is now part of Saanich North and the Islands. An older riding with the name Nanaimo existed from 1871 to 1928.
In 1966, the riding contained the eastern and southern portions of the Nanaimo Regional District, plus Valdes Island and Lasqueti Island.
For the 1979 election, the riding shifted southwards, running from Lantzville in the north to Ladysmith in the south. It also lost Valdes and Lasqueti Islands.
From 1986 to 1991, the riding returned two members. In 1991, the riding shrunk in size. The northern part of the riding, including the northern coast of the City of Nanaimo was transferred to Parksville-Qualicum, while the southern boundary was moved up to the southern limit of the Nanaimo Regional District, except for Valdes Island, which was added back to the riding.
In 2001, the riding's western boundaries were extended to include nearly all of the Nanaimo C Electoral Area.
In 2009, the riding was drastically reduced in size, consisting solely of part of the city of Nanaimo. In the 2017 redistribution, the riding gained part of the City of Nanaimo west of the Nanaimo Parkway.
Member of Legislative Assembly
| Assembly | Years | Member | Party | |
|---|---|---|---|---|
| Nanaimo and the Islands | ||||
| 20th | 1941–1945 | George Sharratt Pearson | Liberal | |
| 21st | 1945–1949 | Coalition | ||
| 22nd | 1949–1952 | |||
| 23rd | 1952–1953 | Larry Giovando | Progressive Conservative | |
| 24th | 1953–1956 | |||
| 25th | 1956–1960 | Earle Westwood | Social Credit | |
| 26th | 1960–1963 | |||
| 27th | 1963–1966 | David Stupich | NDP | |
| Nanaimo | ||||
| 28th | 1966–1969 | David Stupich | NDP | |
| 29th | 1969–1972 | Frank Ney | Social Credit | |
| 30th | 1972–1975 | David Stupich | NDP | |
| 31st | 1975–1979 | |||
| 32nd | 1979–1983 | |||
| 33rd | 1983–1986 | |||
| 34th | 1986–1988 | Dale Lovick David Stupich[2] | ||
| 1989–1991 | Dale Lovick Jan Pullinger | |||
| 35th | 1991–1996 | Dale Lovick | ||
| 36th | 1996–2001 | |||
| 37th | 2001–2005 | Mike Hunter | Liberal | |
| 38th | 2005–2009 | Leonard Krog | NDP | |
| 39th | 2009–2013 | |||
| 40th | 2013–2017 | |||
| 41st | 2017–2018 | |||
| 2019–present | Sheila Malcolmson | |||
Election results
| British Columbia provincial by-election, January 30, 2019 | ||||||||
|---|---|---|---|---|---|---|---|---|
| Party | Candidate | Votes | % | ±% | ||||
| New Democratic | Sheila Malcolmson | 12,114 | 49.88 | +3.34 | ||||
| Liberal | Tony Harris | 9,691 | 39.90 | +7.37 | ||||
| Green | Michele Ney | 1,783 | 7.34 | -12.57 | ||||
| Conservative | Justin Greenwood | 491 | 2.02 | |||||
| Vancouver Island Party | Robin Mark Richardson | 112 | 0.46 | |||||
| Libertarian | Bill Walker | 96 | 0.40 | -0.62 | ||||
| Total | 24,287 | 99.86 | ||||||
| Rejected, spoiled and declined | 33 | 0.14 | -0.36 | |||||
| Turnout | 24,320 | 53.62 | -8.68 | |||||
| Eligible electors | 45,359 | |||||||
| New Democratic hold | Swing | -2.01 | ||||||
| Source: Elections BC[3] | ||||||||
| 2017 British Columbia general election | ||||||||
|---|---|---|---|---|---|---|---|---|
| Party | Candidate | Votes | % | ±% | ||||
| New Democratic | Leonard Krog | 12,746 | 46.54 | +0.83 | ||||
| Liberal | Paris Gaudet | 8,911 | 32.54 | -4.66 | ||||
| Green | Kathleen Harris | 5,454 | 19.91 | +9.31 | ||||
| Libertarian | Bill Walker | 277 | 1.01 | |||||
| Total valid votes | 27,388 | 99.50 | ||||||
| Total rejected ballots | 137 | 0.50 | ||||||
| Turnout | 27,525 | 62.30 | +4.14 | |||||
| Eligible voters | 44,184 | |||||||
| New Democratic hold | Swing | +2.75 | ||||||
| Source: Elections BC[4] | ||||||||
^ Change is based on redistributed results
| 2013 provincial general election redistributed results[5] | |||
|---|---|---|---|
| Party | Vote | % | |
| New Democratic | 11,363 | 45.71 | |
| Liberal | 9,247 | 37.19 | |
| Green | 2,635 | 10.60 | |
| Conservative | 1,344 | 5.41 | |
| Others | 272 | 1.09 | |
| 2013 British Columbia general election | ||||||||
|---|---|---|---|---|---|---|---|---|
| Party | Candidate | Votes | % | ±% | ||||
| New Democratic | Leonard Krog | 10,821 | 46.25 | -7.08 | ||||
| Liberal | Walter Douglas Anderson | 8,568 | 36.62 | +0.32 | ||||
| Green | Ian Elliot Gartshore | 2,532 | 10.82 | +1.68 | ||||
| Conservative | Bryce Nelson Crigger | 1,221 | 5.22 | |||||
| Independent | Brunie Brunie | 253 | 1.08 | |||||
| Total valid votes | 23,395 | 99.56 | ||||||
| Total rejected ballots | 103 | 0.44 | -0.27 | |||||
| Turnout | 23,498 | 57.96 | +0.84 | |||||
| Registered voters | 40,545 | |||||||
| New Democratic hold | Swing | -3.70 | ||||||
| Source: Elections BC[6] | ||||||||
| 2009 British Columbia general election | ||||||||
|---|---|---|---|---|---|---|---|---|
| Party | Candidate | Votes | % | ±% | ||||
| New Democratic | Leonard Krog | 11,877 | 53.33 | +7.9 | ||||
| Liberal | Jeet Manhas | 8,086 | 36.31 | -6.2 | ||||
| Green | Dirk Becker | 2,036 | 9.14 | -0.8 | ||||
| Refederation | Linden Robert Shaw | 272 | 1.22 | |||||
| Total valid votes | 22,271 | 99.29 | ||||||
| Total rejected ballots | 160 | 0.71 | ||||||
| Turnout | 22,431 | 57.12 | ||||||
| Eligible voters | 39,273 | |||||||
| New Democratic hold | Swing | +7.1 | ||||||
^ Change is based on redistributed results.
| 2005 provincial general election redistributed results[7] | |||
|---|---|---|---|
| Party | % | ||
| New Democratic | 45.4 | ||
| Liberal | 42.5 | ||
| Green | 9.9 | ||
| Others | 2.2 | ||
| 2005 British Columbia general election | ||||||||
|---|---|---|---|---|---|---|---|---|
| Party | Candidate | Votes | % | ±% | ||||
| New Democratic | Leonard Krog | 13,226 | 51.90 | +21.67 | ||||
| Liberal | Mike Hunter | 8,657 | 33.97 | -10.67 | ||||
| Green | Doug Catley | 2,933 | 11.51 | -5.94 | ||||
| Marijuana | Mat Dillon | 294 | 1.15 | -2.92 | ||||
| Independent | Brunie Brunie | 204 | 0.80 | -0.11 | ||||
| Refederation | Linden Robert Shaw | 169 | 0.66 | – | ||||
| Total valid votes | 25,483 | 99.45 | ||||||
| Total rejected ballots | 140 | 0.55 | +0.05 | |||||
| Turnout | 25,623 | 62.83 | -7.04 | |||||
| Eligible voters | 40,782 | |||||||
| New Democratic gain from Liberal | Swing | +16.17 | ||||||
| 2001 British Columbia general election | ||||||||
|---|---|---|---|---|---|---|---|---|
| Party | Candidate | Votes | % | ±% | Expenditures | |||
| Liberal | Mike Hunter | 9,748 | 44.64 | +11.28 | $46,911 | |||
| New Democratic | Leonard Krog | 6,602 | 30.23 | -18.51 | $15,152 | |||
| Green | Doug Catley | 3,810 | 17.45 | +15.33 | $3,225 | |||
| Marijuana | Donald Edgar Lavallée | 889 | 4.07 | – | $428 | |||
| Unity | Steve Miller | 588 | 2.69 | – | $1,799 | |||
| Independent | Brunie Brunie | 199 | 0.91 | – | $530 | |||
| Total valid votes | 21,836 | 99.50 | ||||||
| Total rejected ballots | 110 | 0.50 | -0.27 | |||||
| Turnout | 21,946 | 69.87 | +0.08 | |||||
| Registered voters | 31,412 | |||||||
| Liberal gain from New Democratic | Swing | +14.90 | ||||||
| 1996 British Columbia general election | ||||||||
|---|---|---|---|---|---|---|---|---|
| Party | Candidate | Votes | % | ±% | Expenditures | |||
| New Democratic | Dale Lovick | 11,210 | 48.75 | $16,425 | ||||
| Liberal | Gary Korpan | 7,672 | 33.36 | $52,556 | ||||
| Reform | Garry D. Shepp | 1,867 | 8.12 | $6,948 | ||||
| Progressive Democrat | David J. Weston | 1,337 | 5.81 | – | $703 | |||
| Green | Karen M. Shillington | 486 | 2.11 | – | $250 | |||
| Family Coalition | Vicki Podetz | 311 | 1.35 | – | $247 | |||
| Libertarian | Mark Chase | 113 | 0.49 | $365 | ||||
| Total valid votes | 22,996 | 99.23 | ||||||
| Total rejected ballots | 179 | 0.77 | - | |||||
| Turnout | 23,175 | 69.79 | ||||||
| Eligible voters | 33,207 | |||||||
| Party | Candidate | Votes | % | ± | Expenditures | |
|---|---|---|---|---|---|---|
| NDP | Dale Lovick | 11,135 | 51.25% | $39,246 | ||
| Liberal | Raymond A. Brookbank | 7,556 | 34.77% | $1,051 | ||
| Social Credit | Vivian M. Garner | 2,480 | 11.41% | – | $17,601 | |
| Green | Karen M. Shillington | 34 | 1.57% | – | $506 | |
| Family Coalition | David P. Bentley | 145 | 0.67% | – | $226 | |
| Libertarian | Jack Boulogne | 71 | 0.33% | |||
| Total Valid Votes | 21,729 | 100.00% | ||||
| Total Rejected Ballots | 469 | 2.11% | ||||
| Turnout | 22,198 | 74.54% | ||||
| Party | Candidate | Votes | % | ± | Expenditures | |
|---|---|---|---|---|---|---|
| NDP | Jan Pullinger | 14,613 | 57.12% | $36,999 | ||
| Social Credit | Larry McNabb | 9,062 | 35.42% | – | $42,216 | |
| Liberal | Raymond A. Brookbank | 1,908 | 7.46% | $5,414 | ||
| Total Valid Votes | 25,583 | 100.00% | ||||
| Total Rejected Ballots | 183 | 0.71% | ||||
| Turnout | 25,766 | 54.29% | ||||
| Party | Candidate | Votes | % | ± | Expenditures | |
|---|---|---|---|---|---|---|
| NDP | David Stupich | 18,213 | 26.52% | |||
| NDP | Dale Lovick | 17,251 | 25.11% | |||
| Social Credit | Doug McBride | 15,868 | 23.10% | – | ||
| Social Credit | James Alexander (Alex) Stuart | 15,497 | 22.56% | – | ||
| Liberal | Edwin V. Bourke | 1,535 | 2.24% | |||
| Communist | Deborah A. MacDonald | 325 | 0.47% | |||
| Total Valid Votes | 68,689 | 100.00% | ||||
| Total Rejected Ballots | 773 | % | ||||
| Turnout | % | |||||
| 1 two-member seat during this election | ||||||
| Party | Candidate | Votes | % | ± | Expenditures | |
|---|---|---|---|---|---|---|
| NDP | David Stupich | 17,436 | 52.17% | |||
| Social Credit | Graham J.R. Alce | 13,490 | 40.36% | – | ||
| Western Canada Concept | John Lloyd Cowan | 1,090 | 3.26% | |||
| Green | Alan Joseph Timberlake | 625 | 1.87% | – | ||
| Liberal | Shelagh J.F. (Sue) Matthews | 554 | 1.66% | |||
| Independent | Howard Peter Yearwood | 228 | 0.68% | |||
| Total Valid Votes | 33,423 | 100.00% | ||||
| Total Rejected Ballots | 269 | % | ||||
| Turnout | % | |||||
| Party | Candidate | Votes | % | ± | Expenditures | |
|---|---|---|---|---|---|---|
| NDP | David Stupich | 17,021 | 58.69% | |||
| Social Credit | Thomas Wesley (Tom) Humble | 11,979 | 41.31% | – | ||
| Total Valid Votes | 29,000 | 100.00% | ||||
| Total Rejected Ballots | 420 | % | ||||
| Turnout | % | |||||
| Party | Candidate | Votes | % | ± | Expenditures | |
|---|---|---|---|---|---|---|
| NDP | David Stupich | 12,177 | 49.08% | |||
| Social Credit | Graeme C. Roberts | 11,041 | 44.50% | – | ||
| Progressive Conservative | Marjorie Ennis Moore | 869 | 3.50% | |||
| Liberal | William Harold Matthews | 636 | 2.56% | |||
| Communist | Raymond Holmgren | 90 | 0.36% | |||
| Total Valid Votes | 24,813 | 100.00% | ||||
| Total Rejected Ballots | 187 | % | ||||
| Turnout | % | |||||
| Party | Candidate | Votes | % | ± | Expenditures | |
|---|---|---|---|---|---|---|
| NDP | David Stupich | 10,478 | 52.60% | |||
| Social Credit | Frank Ney | 6,409 | 32.17% | – | ||
| Progressive Conservative | Graeme C. Roberts | 1,880 | 9.44% | |||
| Liberal | Lloyd Schoop | 916 | 4.60% | |||
| Independent | Nelson Edward Allen | 238 | 1.19% | |||
| Total Valid Votes | 19,921 | 100.00% | ||||
| Total Rejected Ballots | 327 | % | ||||
| Turnout | % | |||||
| Party | Candidate | Votes | % | ± | Expenditures | |
|---|---|---|---|---|---|---|
| Social Credit | Frank Ney | 8,252 | 49.22% | – | ||
| NDP | David Stupich | 7,790 | 46.47% | |||
| Liberal | Robert Steven Plecas | 722 | 4.31% | |||
| Total Valid Votes | 16,764 | 100.00% | ||||
| Total Rejected Ballots | 153 | % | ||||
| Turnout | % | |||||
| Party | Candidate | Votes | % | ± | Expenditures | |
|---|---|---|---|---|---|---|
| NDP | David Stupich | 5,625 | 47.99% | |||
| Social Credit | Frank Ney | 5,580 | 47.61% | – | ||
| Liberal | Robert Paul Goseltine | 516 | 4.40% | |||
| Total Valid Votes | 11,721 | 100.00% | ||||
| Total Rejected Ballots | 114 | % | ||||
| Turnout | % | |||||
Nanaimo and The Islands (1941-1966)
| Party | Candidate | Votes | % | ± | Expenditures | |
|---|---|---|---|---|---|---|
| NDP | David Stupich | 4,278 | 42.44% | unknown | ||
| Liberal | Robert Clayton Weir | 960 | 9.52% | unknown | ||
| Social Credit | Earle Cathers Westwood | 4,259 | 42.26% | – | unknown | |
| Progressive Conservative | Cornelia Petronella Adriana Wildman | 582 | 5.77% | unknown | ||
| Total valid votes | 10,079 | 100.00% | ||||
| Total rejected ballots | 79 | |||||
| Turnout | 65.33% | |||||
| Party | Candidate | Votes | % | ± | Expenditures | |
|---|---|---|---|---|---|---|
| Co-operative Commonwealth Fed. | Colin Cameron | 4,548 | 41.87% | unknown | ||
| Liberal | Hugh Basil Heath | 1,036 | 9.54% | unknown | ||
| Communist | Irving Floyd Mortensen | 72 | 0.66% | unknown | ||
| Progressive Conservative | Edward Drewry Strongitharm | 607 | 5.59% | unknown | ||
| Social Credit | Earle Cathers Westwood | 4,599 | 42.34% | – | unknown | |
| Total valid votes | 10,862 | 100.00% | ||||
| Total rejected ballots | 151 | |||||
| Turnout | % | |||||
| Party | Candidate | Votes | % | ± | Expenditures | |
|---|---|---|---|---|---|---|
| Independent | Edward Joseph Brewster | 69 | 0.77% | unknown | ||
| Co-operative Commonwealth Fed. | Arthur Roderick Glen | 2,963 | 32.92% | unknown | ||
| Liberal | Peter Maffeo | 2,142 | 23.80% | unknown | ||
| Social Credit | Earle Cathers Westwood | 3,827 | 45.52% | – | unknown | |
| Total valid votes | 9,001 | 100.00% | ||||
| Total rejected ballots | 109 | |||||
| Turnout | % | |||||
| 24th British Columbia election, 1953 2 | ||||||||
|---|---|---|---|---|---|---|---|---|
| Party | Candidate | Votes 1st count |
% | Votes final count |
% | ±% | ||
| Liberal | Elmer Pearce Bradshaw | 1,375 | 13.99% | - | - % | unknown | ||
| Independent | Edward Joseph Brewster | 32 | 0.33% | - | - % | unknown | ||
| Progressive Conservative | Larry Giovando | 2,046 | 20.82% | 4,376 | 50.10% | unknown | ||
| Co-operative Commonwealth Fed. | David Stupich | 3,631 | 36.96% | 4,358 | 49.90% | unknown | ||
| Labor-Progressive | Grace Ellen Tickson | 115 | 1.17% | - | -% | unknown | ||
| Social Credit | Earle Cathers Westwood | 2,626 | 26.73% | |||||
| Total valid votes | 9,825 | 100.00% | 8,734 | % | ||||
| Total rejected ballots | 363 | |||||||
| Total Registered Voters | ||||||||
| Turnout | % | |||||||
| Preferential ballot; final count is between top two candidates from first count; intermediary counts (of 5) not shown | ||||||||
| 23rd British Columbia election, 19521 | ||||||||
|---|---|---|---|---|---|---|---|---|
| Party | Candidate | Votes 1st count |
% | Votes final count |
% | ±% | ||
| Liberal | Elmer Pearce Bradshaw | 2,263 | 21.59% | - | - % | unknown | ||
| Social Credit League | Edward Joseph Brewster | 951 | 9.07% | |||||
| Progressive Conservative | Larry Giovando | 3,346 | 31.92% | 5,144 | 52.89% | unknown | ||
| Labor-Progressive | Nigel Morgan | 207 | 1.97% | - | -% | unknown | ||
| Co-operative Commonwealth Fed. | David Stupich | 3,715 | 35.44% | 4,581 | 47.11% | unknown | ||
| Total valid votes | 10,482 | 100.00% | 9,725 | % | ||||
| Total rejected ballots | 207 | |||||||
| Turnout | % | |||||||
| 1 Preferential ballot; final count is between top two candidates from first count; intermediary counts (of 4) not shown | ||||||||
| Party | Candidate | Votes | % | ± | Expenditures | |
|---|---|---|---|---|---|---|
| Coalition | George Sharratt Pearson | 5,860 | 61.50% | – | unknown | |
| Co-operative Commonwealth Fed. | David Stupich | 3,564 | 37.41% | unknown | ||
| Union of Electors | Herbert William Summers | 104 | 1.09% | – | unknown | |
| Total valid votes | 9,528 | 100.00% | ||||
| Total rejected ballots | 58 | |||||
| Turnout | % | |||||
| Party | Candidate | Votes | % | ± | Expenditures | |
|---|---|---|---|---|---|---|
| Social Credit Alliance | George Henry Broughton | 89 | 1.55% | – | unknown | |
| Coalition | George Sharratt Pearson | 3,124 | 54.24% | – | unknown | |
| Co-operative Commonwealth Fed. | Joseph White | 2,547 | 44.22% | unknown | ||
| Total valid votes | 5,760 | 100.00% | ||||
| Total rejected ballots | 66 | |||||
| Turnout | 63.19% | |||||
| Party | Candidate | Votes | % | ± | Expenditures | |
|---|---|---|---|---|---|---|
| Conservative | Victor Birch Harrison | 1,208 | 24.17% | unknown | ||
| Co-operative Commonwealth Fed. | Thomas O'Connor | 1,615 | 32.31% | unknown | ||
| Liberal | George Sharratt Pearson | 2,175 | 43.52% | unknown | ||
| Total valid votes | 4,998 | 100.00% | ||||
| Total rejected ballots | 62 | |||||
| Turnout | % | |||||
External links
References
- https://elections.bc.ca/docs/rpt/BC-EBC_Final_Report-Sept_24,_2015.pdf
- Seat at this time was a two-member seat Dave Stupich resigned in 1988, Lovick continued to represent district solo until joined by Jan Pullinger in 1989.
- "2019 Nanaimo By-election Interim Voting Results by Voting Area" (PDF). Elections BC. Retrieved 7 May 2019.
- "2017 Provincial General Election Voting Results" (PDF). Elections BC. Retrieved 8 January 2019.
- Pundits' Guide to Canadian Elections
- "Statement of Votes - 40th Provincial General Election" (PDF). Elections BC. Retrieved 17 May 2017.
- UBC Election Stock Market: Assumed Transposition of Votes