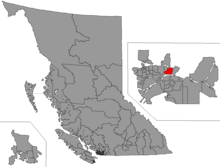
Coquitlam-Maillardville
Coquitlam-Maillardville is a provincial electoral district for the Legislative Assembly of British Columbia, Canada.
 | |||
| Provincial electoral district | |||
| Legislature | Legislative Assembly of British Columbia | ||
| MLA |
New Democratic | ||
| First contested | 1991 | ||
| Last contested | 2017 | ||
| Demographics | |||
| Population (2001) | 50,733 | ||
| Area (km²) | 28.64 | ||
| Pop. density (per km²) | 1,771.4 | ||
| Census divisions | Metro Vancouver | ||
| Census subdivisions | Coquitlam | ||
Demographics
| Population, 2001 | 50,733 |
| Population change, 1996–2001 | 2.6% |
| Area (km²) | 28.64 |
| Pop. density (people per km²) | 1,769 |
Geography
The Coquitlam–Maillardville district encompasses most of land of the City of Coquitlam except for the city centre, Westwood Plateau, and a small corner in the northwest that belongs to the Port Moody-Coquitlam electoral district. Coquitlam–Mallardville is bounded by North Road, the Brunette River, and Braid Street to the west; the Fraser River to the south; and the Coquitlam River, and Westwood Street and its extension south from Kingsway Avenue to the river, to the east. The north and northwest boundary follows the CPR tracks from Westwood Street to just north of Viewmount Drive. It then goes south along Viewmont and continues straight, to the end of Brookmount Road. From here it goes west along Brookmount Road and Brookmount Avenue, north of Fresno Place, Harbour Drive, and Bent Court to Gatensbury Avenue, then south to Foster Avenue, west to Blue Mountain Street, south to Austin, and west to North Road.[1]
History
Members of the Legislative Assembly
| Assembly | Years | Member | Party | |
|---|---|---|---|---|
| 35th | 1991–1996 | John Cashore | New Democratic | |
| 36th | 1996–2001 | |||
| 37th | 2001–2005 | Richard Stewart | Liberal | |
| 38th | 2005–2009 | Diane Thorne | New Democratic | |
| 39th | 2009–2013 | |||
| 40th | 2013–2017 | Selina Robinson | ||
| 41st | 2017–present | |||
Election results
| 2017 British Columbia general election | ||||||||
|---|---|---|---|---|---|---|---|---|
| Party | Candidate | Votes | % | |||||
| New Democratic | Selina Robinson | 11,438 | 50.61 | |||||
| Liberal | Steve Kim | 8,519 | 37.70 | |||||
| Green | Nicola Eyton Spurling | 2,467 | 10.92 | |||||
| Libertarian | Jesse Velay-Vitow | 175 | 0.77 | |||||
| Total valid votes | 22,599 | 100.00 | ||||||
| Source: Elections BC[2] | ||||||||
| 2013 British Columbia general election | ||||||||
|---|---|---|---|---|---|---|---|---|
| Party | Candidate | Votes | % | |||||
| New Democratic | Selina Robinson | 9,930 | 45.74 | |||||
| Liberal | Steve Kim | 9,889 | 45.55 | |||||
| Green | Edward Andreas Stanbrough | 1,891 | 8.71 | |||||
| Total valid votes | 21,710 | 100.00 | ||||||
| Total rejected ballots | 186 | 0.85 | ||||||
| Turnout | 21,896 | 56.69 | ||||||
| Source: Elections BC[3] | ||||||||
| Party | Candidate | Votes | % | ± | Expenditures | |
|---|---|---|---|---|---|---|
| NDP | Diane Thorne | 9,818 | 47.92% | $70,174 | ||
| Liberal | Dennis Marsden | 9,150 | 44.66% | $95,363 | ||
| Green | Stephen Reid | 1,040 | 5.08% | – | $350 | |
| Independent | Doug Stead | 481 | 2.35% | $9,691 | ||
| Total Valid Votes | 20,484 | 100% | ||||
| Total Rejected Ballots | 137 | 0.66% | ||||
| Turnout | 20,621 | 55.22% | ||||
| Party | Candidate | Votes | % | ± | Expenditures | |
|---|---|---|---|---|---|---|
| NDP | Diane Thorne | 10,532 | 46.96% | $48,645 | ||
| Liberal | Richard Stewart | 10,001 | 44.60% | $83,294 | ||
| Green | Michael Hejazi | 1,415 | 6.31% | – | $1,453 | |
| Marijuana | Brandon Steele | 236 | 1.05% | $100 | ||
| Libertarian | Paul Geddes | 173 | 0.77% | $100 | ||
| Platinum | Nattanya Andersen | 69 | 0.31% | – | $100 | |
| Total Valid Votes | 22,426 | 100% | ||||
| Total Rejected Ballots | 156 | 0.70% | ||||
| Turnout | 22,582 | 48.87% | ||||
| Party | Candidate | Votes | % | ± | Expenditures | |
|---|---|---|---|---|---|---|
| Liberal | Richard Stewart | 11,549 | 56.97% | $32,195 | ||
| NDP | Ken Landgraff | 4,442 | 21.90% | $17,917 | ||
| Green | Elly Petersen | 2,522 | 12.44% | – | $466 | |
| Unity | Tim Bonner | 862 | 4.25% | $2,001 | ||
| Marijuana | Paul Geddes | 584 | 2.88% | $721 | ||
| Independent | Harry Warren | 170 | 0.84% | $1,245 | ||
| Independent | Doug Stead | 144 | 0.72% | $200 | ||
| Total valid votes | 20,273 | 100.00% | ||||
| Total rejected ballots | 75 | 0.37% | ||||
| Turnout | 20,348 | 71.42% | ||||
| Party | Candidate | Votes | % | ± | Expenditures | |
|---|---|---|---|---|---|---|
| NDP | John Cashore | 10,812 | 45.91% | $39,269 | ||
| Liberal | Maxine Wilson | 9,440 | 40.08% | $40,547 | ||
| Reform | Bev Welsh | 1,434 | 6.09% | $21,126 | ||
| Progressive Democrat | Angela Broughton | 1,289 | 5.47% | – | $785 | |
| Libertarian | Rob Gillespie | 224 | 0.95% | |||
| Social Credit | Dave Gallagher | 133 | 0.56% | – | $1,449 | |
| Natural Law | Richard Van Schaik | 123 | 0.52% | $123 | ||
| Conservative | Debra Hicks | 96 | 0.41% | |||
| Total valid votes | 23,551 | 100.00% | ||||
| Total rejected ballots | 115 | 0.49% | ||||
| Turnout | 23,666 | 72.33% | ||||
| Party | Candidate | Votes | % | ± | Expenditures | |
|---|---|---|---|---|---|---|
| NDP | John Cashore | 11,136 | 47.18% | $45,717 | ||
| Liberal | Bill F. McGuire | 8,930 | 37.84% | $7,901 | ||
| Social Credit | Bev A. Welsh | 3,354 | 14.21% | – | $18,354 | |
| Independent | Marc (Mikael Ballan) A. R. Boyer | 117 | 0.50% | $790 | ||
| Libertarian | Lewis C. Dahlby | 65 | 0.25% | |||
| Total valid votes | 23,602 | 100.00% | ||||
| Total rejected ballots | 518 | 2.15% | ||||
| Turnout | 24,120 | 75.18% | ||||
See also
References
- "Electoral Maps / Profiles". Elections BC. Archived from the original on 22 July 2010. Retrieved 27 April 2010.
- "2017 Provincial General Election Final Voting Results". Elections BC. Retrieved 6 June 2017.
- "Statement of Votes - 40th Provincial General Election" (PDF). Elections BC. Retrieved 17 May 2017.