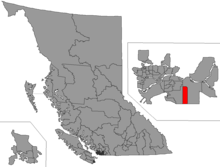
Langley (provincial electoral district)
Langley is a provincial electoral district for the Legislative Assembly of British Columbia, Canada. The riding first appeared in the 1966 general election.
 | |||
| Provincial electoral district | |||
| Legislature | Legislative Assembly of British Columbia | ||
| MLA |
Liberal | ||
| Demographics | |||
| Population (2001) | 54,174 | ||
| Area (km²) | 576 | ||
| Pop. density (per km²) | 94.1 | ||
The riding was created out of the Delta constituency in 1966. Until the election of 1991, it was considered a safe seat for Social Credit. Since then, the Liberals have won the seat by significant margins in six consecutive elections. It returned one MLA from 1966 to 1986, two MLAs from 1986 to 1991, and one MLA from 1991 to the present day.
Demographics
| Population, 2001 | 54,174 |
| Population Change, 1996–2001 | 6.6% |
| Area (km²) | 94 |
| Pop. Density (people per km²) | 576 |
Member of Legislative Assembly
Its MLA is Mary Polak, a former chair of the Surrey school board. She was first elected in 2005 and was re-elected in 2009 and 2013. She is a member of the British Columbia Liberal Party.
| Assembly | Years | Member | Party | ||||
|---|---|---|---|---|---|---|---|
| 28th | 1966–1969 | Hunter Bertram Vogel | Social Credit | ||||
| 29th | 1969–1972 | ||||||
| 30th | 1972–1975 | Robert Howard McClelland | |||||
| 31st | 1975–1979 | ||||||
| 32nd | 1979-1983 | ||||||
| 33rd | 1983-1986 | ||||||
| 34th | 1986–1991 | ||||||
| Two Member District | |||||||
| 34th | 1986–1991 | Carol Gran | Social Credit | ||||
| Dan Peterson | |||||||
| 35th | 1991–1996 | Lynn Stephens | Liberal | ||||
| 36th | 1996–2001 | ||||||
| 37th | 2001–2005 | ||||||
| 38th | 2005–2009 | Mary Polak | |||||
| 39th | 2009–2013 | ||||||
| 40th | 2013–2017 | ||||||
| 41st | 2017–present | ||||||
Election results
| 2017 British Columbia general election | ||||||||
|---|---|---|---|---|---|---|---|---|
| Party | Candidate | Votes | % | Expenditures | ||||
| Liberal | Mary Polak | 10,755 | 44.40 | $57,403 | ||||
| New Democratic | Gail Chaddock-Costello | 8,384 | 34.61 | $9,689 | ||||
| Green | Elizabeth Helen Walker | 3,699 | 15.27 | |||||
| Conservative | Justin Greenwood | 1,221 | 5.04 | $171 | ||||
| Libertarian | Robert Kerr Pobran | 166 | 0.68 | |||||
| Total valid votes | 24,225 | 100.00 | ||||||
| Total rejected ballots | 128 | 0.53 | ||||||
| Turnout | 24,353 | 59.40 | ||||||
| Source: Elections BC[1] | ||||||||
| 2013 British Columbia general election | ||||||||
|---|---|---|---|---|---|---|---|---|
| Party | Candidate | Votes | % | ±% | ||||
| Liberal | Mary Polak | 14,039 | 51.44 | –5.18 | ||||
| New Democratic | Andrew Mercier | 7,403 | 27.13 | –8.64 | ||||
| Conservative | John Cummins | 3,242 | 11.88 | – | ||||
| Green | Wally Martin | 2,608 | 9.55 | +1.95 | ||||
| Total valid votes | 27,292 | 100.00 | ||||||
| Total rejected ballots | 122 | 0.45 | ||||||
| Turnout | 27,414 | 59.06 | ||||||
| Source: Elections BC[2] | ||||||||
| Party | Candidate | Votes | % | ± | |
|---|---|---|---|---|---|
| Liberal | Mary Polak | 13,295 | 56.62% | ||
| NDP | Kathleen Stephany | 8,400 | 35.77% | ||
| Green | Ron Abgrall | 1,788 | 7.61% | – | |
| Total | 23,483 | 100.00% | |||
| Party | Candidate | Votes | % | ± | |
|---|---|---|---|---|---|
| Liberal | Mary Polak | 12,877 | 52.18% | ||
| NDP | Dean Morrison | 8,303 | 33.64% | ||
| Green | Kathleen Blanche Stephany | 3,042 | 12.33% | – | |
| Marijuana | Chris Scrimes | 278 | 1.13% | ||
| Platinum | Lee Anthony Davies | 180 | 0.73% | – | |
| Total | 24,680 | 100.00% | |||
| Party | Candidate | Votes | % | ± | Expenditures | |
|---|---|---|---|---|---|---|
| Liberal | Lynn Stephens | 14,564 | 64.85% | $47,825 | ||
| Green | Pat Taylor | 2,847 | 12.68% | – | $492 | |
| NDP | Paul Latham | 2,720 | 12.11% | $1,961 | ||
| Unity | Gordon Nelson | 1,605 | 7.15% | $4,453 | ||
| Marijuana | Mavis Becker | 723 | 3.21% | $721 | ||
| Total valid votes | 22,459 | 100.00% | ||||
| Total rejected ballots | 66 | 0.29% | ||||
| Turnout | 22,525 | 71.97% | ||||
| Party | Candidate | Votes | % | ± | Expenditures | |
|---|---|---|---|---|---|---|
| Liberal | Lynn Stephens | 9,277 | 46.62% | $50,227 | ||
| NDP | Kim Richter | 5,795 | 29.12% | $17,136 | ||
| Reform | Joe Lopushinsky | 3,224 | 16.20% | $33,546 | ||
| Progressive Democrat | Paul MacDonald | 1,195 | 6.00% | – | ||
| Green | Fely Gotia-Walters | 262 | 1.32% | – | $240 | |
| Social Credit | Ian B. Thompson | 148 | 0.74% | – | $5,178 | |
| Total valid votes | 19,901 | 100.00% | ||||
| Total rejected ballots | 125 | 0.62% | ||||
| Turnout | 20,026 | 73.19% | ||||
| Party | Candidate | Votes | % | ± | Expenditures | |
|---|---|---|---|---|---|---|
| Liberal | Lynn Stephens | 7,149 | 38.95% | $5,383 | ||
| NDP | Derrill Thompson | 5,762 | 31.39% | $22,296 | ||
| Social Credit | Carol M. Gran | 5,201 | 28.34% | – | $62,018 | |
| Family Coalition | Barrie O. Norman | 180 | 0.98% | – | $1,323 | |
| Independent | Nora E. Galenzoski | 62 | 0.34% | $120 | ||
| Total valid votes | 18,354 | 100.00% | ||||
| Total rejected ballots | 354 | 1.89% | ||||
| Turnout | 18,708 | 76.24% | ||||
gollark: Just noticed this in a progeny:https://dragcave.net/view/L5EONIt was the child of a chrono but unfortunately came out thalassa. And isn't mine.
gollark: I mean, apart from `Sol`, but that's only 3 letters.
gollark: What would it be *otherwise*?
gollark: Also, worrying.
gollark: Noooo!
External links
References
- "Statement of Votes – 41st Provincial General Election – May 9, 2017" (PDF). Elections BC. Retrieved December 7, 2019.
- "Statement of Votes - 40th Provincial General Election" (PDF). Elections BC. Retrieved 17 May 2017.
This article is issued from Wikipedia. The text is licensed under Creative Commons - Attribution - Sharealike. Additional terms may apply for the media files.