List of countries by income equality
This is a list of countries or dependencies by income inequality metrics, including Gini coefficients. The Gini coefficient is a number between 0 and 1, where 0 corresponds with perfect equality (where everyone has the same income) and 1 corresponds with perfect inequality (where one person has all the income—and everyone else has no income).
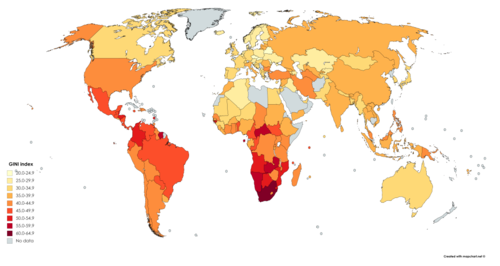
World map of the GINI coefficients by country. Based on World Bank data ranging from 1992 to 2018.[1]
Income distribution can vary greatly from wealth distribution in a country (see List of countries by distribution of wealth). Income from black market economic activity is not included and is the subject of current economic research.[2][3]
UN, World Bank and CIA list – income ratios and Gini indices
- Click sorting buttons to sort alphabetically or numerically. Can sort in ascending or descending order. The row number column on the left is fixed.
Key:
- R/P 10%
- The ratio of the average income of the richest 10% to the poorest 10%.
- R/P 20%
- The ratio of the average income of the richest 20% to the poorest 20%.
- Gini
- Gini index, a quantified representation of a nation's Lorenz curve. A Gini index of 0% expresses perfect equality, while index of 100% expresses maximal inequality.
- UN
- Data from the United Nations Development Programme.
- World Bank
- Data from the World Bank.
- CIA
- Data from the Central Intelligence Agency's The World Factbook.
|
| ||||||||||||||||||||||||||||||||||||||||||||||||||||||||||||||||||||||||||||||||||||||||||||||||||||||||||||||||||||||||||||||||||||||||||||||||||||||||||||||||||||||||||||||||||||||||||||||||||||||||||||||||||||||||||||||||||||||||||||||||||||||||||||||||||||||||||||||||||||||||||||||||||||||||||||||||||||||||||||||||||||||||||||||||||||||||||||||||||||||||||||||||||||||||||||||||||||||||||||||||||||||||||||||||||||||||||||||||||||||||||||||||||||||||||||||||||||||||||||||||||||||||||||||||||||||||||||||||||||||||||||||||||||||||||||||||||||||||||||||||||||||||||||||||||||||||||||||||||||||||||||||||||||||||||||||||||||||||||||||||||||||||||||||||||||||||||||||||||||||||||||||||||||||||||||||||||||||||||||||||||||||||||||||||||||||||||||||||||||||||||||||||||||||||||||||||||||||||||||||||||||||||||||||||||||||||||||||||||||||||||||||||||||||||||||||||||||||||||||||||||||||||||||||||||||||||||||||||||||||||||||||||||||||||||||||||||||||||||||||||||||||||||||||||||||||||||||||||||||||
Other estimates for the World: Gini = 63.0 in 2006 (Lafuente et al, 2006).[11]
EU27 countries
|
|
OECD countries
Gini coefficient, before taxes and transfers
|
|
Gini coefficient, after taxes and transfers
|
|
gollark: I have somehow missed this.
gollark: What library?
gollark: You need a Builder (to hold the quarry card) and a quarry card (to quarry).
gollark: Or shape manual. Something like that.
gollark: Shape card manual, I think.
See also
- List of countries by inequality-adjusted HDI
- List of countries by the share of income of the richest one percent
- List of countries by percentage of population living in poverty
Notes
- Serbia is a negotiating candidate to the EU.
- Montenegro is a negotiating candidate to the EU.
References
- "GINI index (World Bank estimate) | Data". data.worldbank.org. Retrieved 2020-07-23.
- Underground economy and income inequality: two connected aspects in the oncoming context of Italian federalism Archived 2012-02-09 at the Wayback Machine. By Iacopo Odoardi and Carmen Pagliari. Vol. 15 No. 1, 2011 Archived 2012-02-09 at the Wayback Machine. Global & Local Economic Review.
- The Size of the Shadow Economies of 145 Countries all over the World: First Results over the Period 1999 to 2003. December 2004. By Friedrich Schneider (University of Linz and IZA Bonn). Institute for the Study of Labor.
- "GINI index (World Bank estimate)". data.worldbank.org. World Bank. Retrieved 30 March 2020.
- Data show the ratio of the household income or consumption share of the richest group to that of the poorest. Household income or consumption by percentage share (%), The World Factbook, CIA, updated on January 24, 2008. Note: To calculate the value given in the table for this article, the highest 10% value was divided by the lowest 10% value.
- Distribution of family income – Gini index, The World Factbook, CIA, accessed on November 24, 2011.
- Data show the ratio of the income or expenditure share of the richest group to that of the poorest. Human Development Report 2009, UNDP, accessed on July 30, 2011.
- "| Human Development Reports". hdr.undp.org. Retrieved 2019-03-04.
- Data for urban households only.
- "Poverty and Inequality Index". National Bureau of Statistics. Retrieved 2020-06-08.
- Lafuente Lechuga, Matilde; Losa Carmona, Antonio; Sánchez Martínez, Antonio. 2016. «Análisis de la evolución de la desigualdad económica mundial en los últimos años» (pdf). XVI Jornadas de ASEPUMA y II Encuentro Internacional. Consultado el 12 de abril de 2014.
- "Gini coefficient of equivalised disposable income – EU-SILC survey". ec.europa.eu/eurostat. Eurostat. Retrieved 14 August 2020.
- "GINI Index for Montenegro". 18 January 2018. Cite journal requires
|journal=(help) - OECD. "Income Distribution and Poverty : by country –I nequalityY". Archived from the original on 2015-04-02.
Further reading
- "An Overview of Growing Income Inequalities in OECD Countries: Main Findings" (PDF), Divided We Stand: Why Inequality Keeps Growing, OECD Publishing, December 2011, ISBN 978-92-64-11163-9, retrieved 6 December 2011. This book released with two titles, depending on country of publication. However, the ISBN remains the same.
- Fed’s Brainard Says Middle Class Squeeze Poses Risks to Economy, May 2019, retrieved 15 May 2019 USA's Gini index is now .482 according to Federal Reserve Governor Lael Brainard.
External links
- Global Peace Index Map of Gini data for 2007–2010
- Shadow economies all over the world : new estimates for 162 countries from 1999 to 2007. Friedrich Schneider, Andreas Buehn, Claudio E. Montenegro. July 2010. World Bank.
- Allianz Global Wealth Report 2018.
This article is issued from Wikipedia. The text is licensed under Creative Commons - Attribution - Sharealike. Additional terms may apply for the media files.