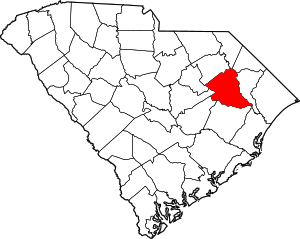
Florence County, South Carolina
Florence County is a county located in the U.S. state of South Carolina. As of the 2010 census, its population was 136,885.[1] Its county seat is Florence.[2]
Florence County | |
|---|---|
 | |
 Seal | |
 Location within the U.S. state of South Carolina | |
 South Carolina's location within the U.S. | |
| Coordinates: 34°01′N 79°43′W | |
| Country | |
| State | |
| Founded | 1888 |
| Seat | Florence |
| Largest city | Florence |
| Area | |
| • Total | 804 sq mi (2,080 km2) |
| • Land | 800 sq mi (2,000 km2) |
| • Water | 3.8 sq mi (10 km2) 0.5%% |
| Population (2010) | |
| • Total | 136,885 |
| • Estimate (2019) | 138,293 |
| • Density | 170/sq mi (66/km2) |
| Time zone | UTC−5 (Eastern) |
| • Summer (DST) | UTC−4 (EDT) |
| Congressional districts | 6th, 7th |
| Website | www |
Florence County is included in the Florence, SC Metropolitan Statistical Area. The county's population is about 60% urban.
History
Florence County was formed from main sections of Darlington and Marion Counties plus other townships from Williamsburg and Clarendon Counties, starting in 1888. The last section of Williamsburg County was not added until 1921. Florence County was named for the daughter of General W. W. Harlee.[3]
Geography
According to the U.S. Census Bureau, the county has a total area of 804 square miles (2,080 km2), of which 800 square miles (2,100 km2) is land and 3.8 square miles (9.8 km2) (0.5%) is water.[4]
Adjacent counties
- Williamsburg County – south
- Marion County – east
- Dillon County – north
- Marlboro County – north
- Darlington County – northwest
- Lee County – west
- Sumter County – southwest
- Clarendon County – southwest
Demographics
| Historical population | |||
|---|---|---|---|
| Census | Pop. | %± | |
| 1890 | 25,027 | — | |
| 1900 | 28,474 | 13.8% | |
| 1910 | 35,671 | 25.3% | |
| 1920 | 50,406 | 41.3% | |
| 1930 | 61,027 | 21.1% | |
| 1940 | 70,582 | 15.7% | |
| 1950 | 79,710 | 12.9% | |
| 1960 | 84,438 | 5.9% | |
| 1970 | 89,636 | 6.2% | |
| 1980 | 110,163 | 22.9% | |
| 1990 | 114,344 | 3.8% | |
| 2000 | 125,761 | 10.0% | |
| 2010 | 136,885 | 8.8% | |
| Est. 2019 | 138,293 | [5] | 1.0% |
| U.S. Decennial Census[6] 1790–1960[7] 1900–1990[8] 1990–2000[9] 2010–2019[1] | |||
2000 census
At the 2000 census there were 125,761 people, 47,147 households, and 33,804 families living in the county. The population density was 157 people per square mile (61/km²). There were 51,836 housing units at an average density of 65 per square mile (25/km²). The racial makeup of the county was 58.65% White, 39.34% Black or African American, 0.22% Native American, 0.70% Asian, 0.02% Pacific Islander, 0.39% from other races, and 0.68% from two or more races. 1.10% of the population were Hispanic or Latino of any race.[10] Of the 47,147 households 33.80% had children under the age of 18 living with them, 49.70% were married couples living together, 18.10% had a female householder with no husband present, and 28.30% were non-families. 24.50% of households were one person and 8.20% were one person aged 65 or older. The average household size was 2.59 and the average family size was 3.08.
The age distribution was 25.90% under the age of 18, 9.70% from 18 to 24, 28.90% from 25 to 44, 23.60% from 45 to 64, and 11.80% 65 or older. The median age was 36 years. For every 100 females, there were 88.70 males. For every 100 females age 18 and over, there were 84.20 males.
The median household income was $35,144 and the median family income was $41,274. Males had a median income of $32,065 versus $21,906 for females. The per capita income for the county was $17,876. About 13.50% of families and 16.40% of the population were below the poverty line, including 22.30% of those under age 18 and 16.50% of those age 65 or over.
In census 2000, the population of Florence County was classified as 58% urban and 42% rural, containing the two urban areas of Florence (2000 pop. 67,314) and Lake City (8,728). Along with Darlington County, it comprises part of the Florence Metropolitan Statistical Area.
2010 census
At the 2010 census, there were 136,885 people, 52,653 households, and 36,328 families living in the county.[11] The population density was 171.1 inhabitants per square mile (66.1/km2). There were 58,666 housing units at an average density of 73.3 per square mile (28.3/km2).[12] The racial makeup of the county was 54.9% white, 41.3% black or African American, 1.2% Asian, 0.3% American Indian, 1.1% from other races, and 1.1% from two or more races. Those of Hispanic or Latino origin made up 2.2% of the population.[11] In terms of ancestry, 8.4% were American, 7.8% were English, 6.7% were Irish, and 6.2% were German.[13]
Of the 52,653 households, 35.2% had children under the age of 18 living with them, 44.7% were married couples living together, 19.6% had a female householder with no husband present, 31.0% were non-families, and 26.3% of households were made up of individuals. The average household size was 2.54 and the average family size was 3.06. The median age was 37.6 years.[11]
The median household income was $40,487 and the median family income was $48,896. Males had a median income of $38,934 versus $30,163 for females. The per capita income for the county was $21,932. About 14.5% of families and 18.0% of the population were below the poverty line, including 26.1% of those under age 18 and 14.0% of those age 65 or over.[14]
Politics
| Year | Republican | Democratic | Third parties |
|---|---|---|---|
| 2016 | 51.1% 29,573 | 46.1% 26,710 | 2.8% 1,648 |
| 2012 | 49.8% 28,961 | 49.2% 28,614 | 0.9% 547 |
| 2008 | 51.2% 29,861 | 48.0% 28,012 | 0.9% 500 |
| 2004 | 55.9% 27,689 | 43.3% 21,442 | 0.8% 414 |
| 2000 | 57.1% 23,678 | 41.4% 17,157 | 1.5% 602 |
| 1996 | 51.3% 18,490 | 43.8% 15,804 | 4.9% 1,776 |
| 1992 | 50.8% 19,802 | 39.9% 15,569 | 9.3% 3,632 |
| 1988 | 60.5% 19,490 | 38.9% 12,531 | 0.6% 193 |
| 1984 | 60.5% 22,753 | 38.9% 14,639 | 0.6% 208 |
| 1980 | 50.2% 17,069 | 48.2% 16,391 | 1.6% 551 |
| 1976 | 45.3% 13,539 | 54.5% 16,294 | 0.2% 71 |
| 1972 | 65.3% 18,106 | 34.1% 9,455 | 0.6% 165 |
| 1968 | 36.2% 8,917 | 32.8% 8,079 | 31.0% 7,642 |
| 1964 | 59.1% 10,346 | 40.9% 7,157 | |
| 1960 | 48.8% 5,815 | 51.2% 6,090 | 0.0% 1 |
| 1956 | 19.0% 1,855 | 35.5% 3,463 | 45.5% 4,447 |
| 1952 | 49.5% 5,236 | 50.5% 5,340 | |
| 1948 | 3.8% 192 | 23.3% 1,189 | 73.0% 3,729 |
| 1944 | 4.0% 128 | 87.9% 2,822 | 8.2% 262 |
| 1940 | 3.5% 95 | 96.5% 2,597 | |
| 1936 | 0.6% 25 | 99.4% 4,194 | |
| 1932 | 0.9% 29 | 99.0% 3,195 | 0.1% 2 |
| 1928 | 5.3% 93 | 94.7% 1,672 | |
| 1924 | 2.5% 32 | 93.5% 1,217 | 4.0% 52 |
| 1920 | 4.3% 79 | 95.7% 1,763 | |
| 1916 | 1.3% 26 | 98.7% 1,912 | |
| 1912 | 0.4% 6 | 95.1% 1,496 | 4.5% 71 |
| 1904 | 2.1% 31 | 97.9% 1,466 | |
| 1900 | 5.4% 74 | 94.6% 1,290 |
References
- "State & County QuickFacts". United States Census Bureau. Archived from the original on June 6, 2011. Retrieved November 23, 2013.
- "Find a County". National Association of Counties. Archived from the original on 2011-05-31. Retrieved 2011-06-07.
- Gannett, Henry (1905). The Origin of Certain Place Names in the United States. Govt. Print. Off. pp. 127.
- "2010 Census Gazetteer Files". United States Census Bureau. August 22, 2012. Retrieved March 17, 2015.
- "Population and Housing Unit Estimates". Retrieved May 21, 2020.
- "U.S. Decennial Census". United States Census Bureau. Retrieved March 17, 2015.
- "Historical Census Browser". University of Virginia Library. Retrieved March 17, 2015.
- Forstall, Richard L., ed. (March 27, 1995). "Population of Counties by Decennial Census: 1900 to 1990". United States Census Bureau. Retrieved March 17, 2015.
- "Census 2000 PHC-T-4. Ranking Tables for Counties: 1990 and 2000" (PDF). United States Census Bureau. April 2, 2001. Retrieved March 17, 2015.
- "U.S. Census website". United States Census Bureau. Retrieved 2011-05-14.
- "DP-1 Profile of General Population and Housing Characteristics: 2010 Demographic Profile Data". United States Census Bureau. Archived from the original on 2020-02-13. Retrieved 2016-03-09.
- "Population, Housing Units, Area, and Density: 2010 – County". United States Census Bureau. Archived from the original on 2020-02-13. Retrieved 2016-03-09.
- "DP02 SELECTED SOCIAL CHARACTERISTICS IN THE UNITED STATES – 2006–2010 American Community Survey 5-Year Estimates". United States Census Bureau. Archived from the original on 2020-02-13. Retrieved 2016-03-09.
- "DP03 SELECTED ECONOMIC CHARACTERISTICS – 2006–2010 American Community Survey 5-Year Estimates". United States Census Bureau. Archived from the original on 2020-02-13. Retrieved 2016-03-09.
- Leip, David. "Dave Leip's Atlas of U.S. Presidential Elections". uselectionatlas.org. Retrieved 2018-03-13.
External links
- Florence County Website
- 1905 Reprint of Bishop Gregg's History of the Old Cheraws with additional material as an appendix. (Google Book pdf)
- Florence County History and Images
