2019 Colchester Borough Council election
Elections to Colchester Borough Council were held on 2 May 2019. Seventeen members of the council (one-third of the whole) were up for election, one from each of the 17 wards.[1]
| |||||||||||||||||||||||||||||||||||||||||||||||||||||||||||||||||||||||||||
17 seats (out of 51 seats) 26 seats needed for a majority | |||||||||||||||||||||||||||||||||||||||||||||||||||||||||||||||||||||||||||
|---|---|---|---|---|---|---|---|---|---|---|---|---|---|---|---|---|---|---|---|---|---|---|---|---|---|---|---|---|---|---|---|---|---|---|---|---|---|---|---|---|---|---|---|---|---|---|---|---|---|---|---|---|---|---|---|---|---|---|---|---|---|---|---|---|---|---|---|---|---|---|---|---|---|---|---|
| Turnout | 32.6% ( | ||||||||||||||||||||||||||||||||||||||||||||||||||||||||||||||||||||||||||
| |||||||||||||||||||||||||||||||||||||||||||||||||||||||||||||||||||||||||||
Result Summary
Candidates by Party
Conservative Party (17/17)
Liberal Democrats (17/17)
Labour Party (17/17)
Green Party (17/17)
Independent (4/17)
UKIP (1/17)
Result

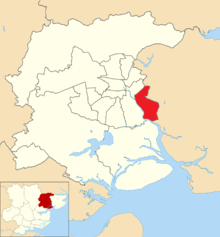
Results map of the Borough Council election
| Colchester Borough Council election, 2019 | ||||||||||
|---|---|---|---|---|---|---|---|---|---|---|
| Party | This election | Full council | This election | |||||||
| Seats | Net | Seats % | Other | Total | Total % | Votes | Votes % | +/− | ||
| Conservative | 6 | 35.3 | 17 | 23 | 45.1 | 15,387 | 35.2 | |||
| Liberal Democrats | 6 | 35.3 | 7 | 13 | 25.5 | 11,638 | 26.6 | |||
| Labour | 3 | 17.6 | 8 | 11 | 21.6 | 7,740 | 17.7 | |||
| Independent | 1 | 5.9 | 2 | 3 | 5.9 | 2,775 | 6.3 | |||
| Green | 1 | 5.9 | 0 | 1 | 2.0 | 5,939 | 13.6 | |||
| UKIP | 0 | 0.0 | 0 | 0 | 0.0 | 248 | 0.6 | New | ||
Composition
Prior to the election, the composition of the council was:
| 12 | 11 | 3 | 25 |
| Liberal Democrats | Labour | Ind | Conservative |
Following the election, the composition of the council was:
| 13 | 11 | 3 | 1 | 23 |
| Liberal Democrats | Labour | Ind | G | Conservative |
Ward results
The Statement of Nominated Persons was released on 4 April 2019 detailing the persons standing as candidates at the Borough Council election.[2]
Incumbent councillors are marked with an asterisk*
Berechurch
Berechurch ward
| Party | Candidate | Votes | % | ± | |
|---|---|---|---|---|---|
| Labour Co-op | Chris Pearson* | 1,058 | 53.2 | ||
| Liberal Democrats | Mick Spindler | 490 | 24.6 | ||
| Conservative | Fabian Green | 301 | 15.1 | ||
| Green | Mary Bryan | 142 | 7.1 | ||
| Majority | 568 | 28.6 | |||
| Turnout | 1,991 | 27.4 | |||
| Labour Co-op hold | Swing | ||||
Castle
Castle ward
| Party | Candidate | Votes | % | ± | |
|---|---|---|---|---|---|
| Green | Mark Goacher | 1,724 | 55.9 | ||
| Conservative | Darius Laws* | 901 | 29.2 | ||
| Labour | Victoria Weaver | 268 | 8.7 | ||
| Liberal Democrats | Verity Wooley | 193 | 6.3 | ||
| Majority | 823 | 26.7 | — | ||
| Turnout | 3,086 | 40.5 | |||
| Green gain from Conservative | Swing | ||||
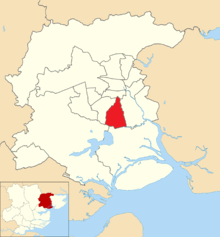
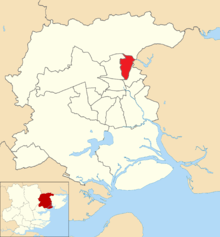
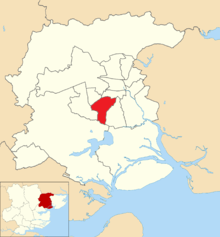
Greenstead
Greenstead ward
| Party | Candidate | Votes | % | ± | |
|---|---|---|---|---|---|
| Labour | Tim Young* | 971 | 47.7 | ||
| Conservative | Christopher Piggott | 388 | 19.0 | ||
| Liberal Democrats | Chantelle-Louise Whyborn | 281 | 13.8 | ||
| Independent | Christopher Lee | 228 | 11.2 | ||
| Green | John Clifton | 169 | 8.3 | ||
| Majority | 583 | 28.7 | — | ||
| Turnout | 2,037 | 20.4 | |||
| Labour hold | Swing | ||||
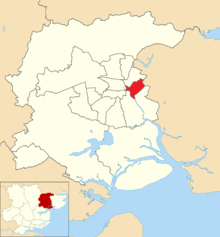
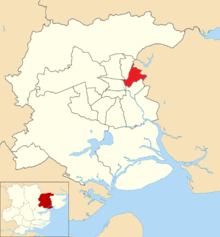
Highwoods
Highwoods ward
| Party | Candidate | Votes | % | ± | |
|---|---|---|---|---|---|
| Independent | Bev Oxford* | 1,119 | 52.6 | ||
| Conservative | Stephen Rowe | 409 | 19.3 | ||
| Labour | Jocelyn Law | 247 | 11.6 | ||
| Liberal Democrats | Mick Turrell | 196 | 9.2 | ||
| Green | Robbie Spence | 155 | 7.3 | ||
| Majority | 710 | 33.3 | — | ||
| Turnout | 2,126 | 29.4 | |||
| Independent hold | Swing | ||||
Lexden & Braiswick
Lexden & Braiswick ward
| Party | Candidate | Votes | % | ± | |
|---|---|---|---|---|---|
| Conservative | Lewis Barber* | 1,745 | 62.3 | ||
| Liberal Democrats | Thomas Stevenson | 442 | 15.8 | ||
| Green | Roger Bamforth | 403 | 14.5 | ||
| Labour | Conrad Winch | 209 | 7.5 | ||
| Majority | 1,303 | 46.5 | — | ||
| Turnout | 2,799 | 39.2 | |||
| Conservative hold | Swing | ||||
Marks Tey & Layer
Marks Tey & Layer ward
| Party | Candidate | Votes | % | ± | |
|---|---|---|---|---|---|
| Conservative | Andrew Ellis* | 1,560 | 64.6 | ||
| Green | Matt Stemp | 345 | 14.3 | ||
| Liberal Democrats | Mark Hull | 328 | 13.6 | ||
| Labour | Jan Plummer | 180 | 7.5 | ||
| Majority | 1,215 | 50.3 | — | ||
| Turnout | 2,413 | 32.6 | |||
| Conservative hold | Swing | ||||
Mersea & Pyefleet
Mersea & Pyefleet ward
| Party | Candidate | Votes | % | ± | |
|---|---|---|---|---|---|
| Conservative | Patricia Moore* | 1,026 | 30.3 | ||
| Independent | John Akker | 969 | 28.6 | ||
| Independent | Carl Powling | 459 | 13.5 | New | |
| Green | Peter Banks | 310 | 9.1 | ||
| Labour | Bry Mogridge | 263 | 7.8 | ||
| UKIP | David Broise | 248 | 7.3 | New | |
| Liberal Democrats | Jenny Stevens | 114 | 3.4 | ||
| Majority | 57 | 1.7 | |||
| Turnout | 3,389 | 42.4 | |||
| Conservative hold | Swing | ||||
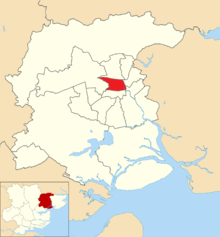
Mile End
Mile End ward
| Party | Candidate | Votes | % | ± | |
|---|---|---|---|---|---|
| Liberal Democrats | Phil Coleman* | 1,447 | 62.2 | ||
| Conservative | Natalie Rowe | 463 | 19.9 | ||
| Green | Amanda Kirke | 216 | 9.3 | ||
| Labour | Sarah Ryder | 201 | 8.6 | ||
| Majority | 984 | 42.7 | |||
| Turnout | 2,327 | 28.6 | |||
| Liberal Democrats hold | Swing | ||||
No Independent candidate as previous (−1.8).
New Town & Christ Church
New Town & Christ Church ward
| Party | Candidate | Votes | % | ± | |
|---|---|---|---|---|---|
| Liberal Democrats | Nick Cope* | 1,128 | 36.2 | ||
| Labour | Elisa Vasquez-Walters | 992 | 31.9 | ||
| Conservative | Carla Hales | 604 | 19.4 | ||
| Green | Bob Brannan | 390 | 12.5 | ||
| Majority | 136 | 4.3 | — | ||
| Turnout | 3,114 | 33.4 | |||
| Liberal Democrats hold | Swing | ||||
No Independent candidate as previous (−2.3).
Old Heath & The Hythe
Old Heath & The Hythe ward
| Party | Candidate | Votes | % | ± | |
|---|---|---|---|---|---|
| Labour | Adam Fox* | 1,181 | 52.0 | ||
| Conservative | Michael McDonnell | 475 | 20.9 | ||
| Green | Andrew Canessa | 323 | 14.2 | ||
| Liberal Democrats | Mark Kiley | 292 | 12.9 | ||
| Majority | 706 | 31.1 | — | ||
| Turnout | 2,271 | 27.5 | |||
| Labour hold | Swing | ||||
No Independent candidate as previous (−3.8).
Prettygate
Prettygate ward
| Party | Candidate | Votes | % | ± | |
|---|---|---|---|---|---|
| Conservative | Beverly Davis* | 1,520 | 54.1 | ||
| Liberal Democrats | John Loxley | 600 | 21.4 | ||
| Labour | Jamie Overland | 351 | 12.5 | ||
| Green | Clare Palmer | 336 | 12.0 | ||
| Majority | 920 | 32.7 | — | ||
| Turnout | 2,807 | 36.3 | — | ||
| Conservative hold | Swing | ||||
Rural North
Rural North ward
| Party | Candidate | Votes | % | ± | |
|---|---|---|---|---|---|
| Conservative | Nigel Chapman* | 1,786 | 61.4 | ||
| Green | Sue Bailey | 454 | 15.6 | ||
| Liberal Democrats | Will Brown | 445 | 15.3 | ||
| Labour | Judith Short | 225 | 7.7 | ||
| Majority | 1,332 | 45.8 | — | ||
| Turnout | 2,910 | 34.9 | |||
| Conservative hold | Swing | ||||
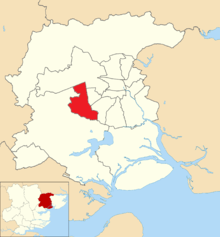
Shrub End
Shrub End ward
| Party | Candidate | Votes | % | ± | |
|---|---|---|---|---|---|
| Liberal Democrats | Sam McCarthy | 878 | 41.6 | ||
| Conservative | Vic Flores* | 714 | 33.8 | ||
| Labour Co-op | Rosalind Scott | 364 | 17.3 | ||
| Green | Blake Roberts | 154 | 7.3 | ||
| Majority | 164 | 7.8 | — | ||
| Turnout | 2,110 | 27.3 | |||
| Liberal Democrats gain from Conservative | Swing | ||||
No Independent candidate as previous (−3.8).
St. Anne's & St. John's
St. Anne's & St. John's ward
| Party | Candidate | Votes | % | ± | |
|---|---|---|---|---|---|
| Liberal Democrats | Helen Chuah* | 1,238 | 44.4 | ||
| Conservative | Thomas Rowe | 1,118 | 40.1 | ||
| Green | Megan Maltby | 217 | 7.8 | ||
| Labour | HK Norman | 213 | 7.7 | ||
| Majority | 120 | 4.3 | — | ||
| Turnout | 2,786 | 34.3 | |||
| Liberal Democrats hold | Swing | ||||
No Independent candidate as previous (−3.5).
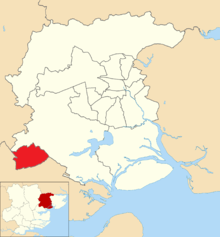
Stanway
Stanway ward
| Party | Candidate | Votes | % | ± | |
|---|---|---|---|---|---|
| Liberal Democrats | Lesley Scott-Boutell* | 1,237 | 52.7 | ||
| Conservative | Jeremy Hagon | 795 | 33.9 | ||
| Green | Katie Francis | 171 | 7.3 | ||
| Labour | John Spademan | 143 | 6.1 | ||
| Majority | 442 | 18.8 | — | ||
| Turnout | 2,346 | 35.0 | |||
| Liberal Democrats hold | Swing | ||||
Tiptree
Tiptree ward
| Party | Candidate | Votes | % | ± | |
|---|---|---|---|---|---|
| Conservative | Barbara Wood* | 1,315 | 64.2 | ||
| Labour | Paul Jeffs | 303 | 14.8 | ||
| Green | Wolfgang Fauser | 232 | 11.3 | ||
| Liberal Democrats | Gemma Graham | 198 | 9.7 | ||
| Majority | 1,012 | 49.4 | — | ||
| Turnout | 2,048 | 29.3 | |||
| Conservative hold | Swing | ||||
Wivenhoe
Wivenhoe ward
| Party | Candidate | Votes | % | ± | |
|---|---|---|---|---|---|
| Liberal Democrats | Mark Cory* | 2,131 | 67.3 | ||
| Labour | Harry Nathan | 571 | 18.0 | ||
| Conservative | Jodie Clark | 267 | 8.4 | ||
| Green | John McArthur | 198 | 6.3 | ||
| Majority | 1,560 | 49.3 | — | ||
| Turnout | 3,167 | 39.1 | |||
| Liberal Democrats hold | Swing | ||||
gollark: Deploying counterapiomemetics
gollark: 86%...
gollark: 85% done downloading Wikipedia.
gollark: Duckyo, ducko.
gollark: Andrew is a complete `Chrome/84.0.4147.135`.
References
This article is issued from Wikipedia. The text is licensed under Creative Commons - Attribution - Sharealike. Additional terms may apply for the media files.