1995 Basildon District Council election
The 1995 Basildon District Council election took place on 4 May 1995 to elect members of Basildon District Council in Essex, England. This was on the same day as other local elections. One third of the council was up for election; the seats which were last contested in 1991. The council remained under no overall control.
| |||||||||||||||||||||||||||||||||
14 of the 42 seats to Basildon District Council 22 seats needed for a majority | |||||||||||||||||||||||||||||||||
|---|---|---|---|---|---|---|---|---|---|---|---|---|---|---|---|---|---|---|---|---|---|---|---|---|---|---|---|---|---|---|---|---|---|
| |||||||||||||||||||||||||||||||||
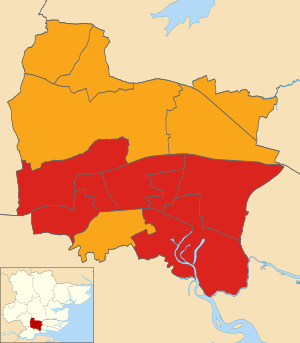 Map showing the results of contested wards in the 1995 Basildon Borough Council elections. | |||||||||||||||||||||||||||||||||
| |||||||||||||||||||||||||||||||||
Overall results
| Party | Seats | Gains | Losses | Net gain/loss | Seats % | Votes % | Votes | +/− | |
|---|---|---|---|---|---|---|---|---|---|
| Labour | 8 | 3 | 0 | 57.1 | 48.3 | 22,614 | |||
| Liberal Democrats | 6 | 4 | 0 | 42.9 | 23.5 | 10,994 | |||
| Conservative | 0 | 0 | 7 | 0.0 | 28.0 | 13,124 | |||
| Militant Labour | 0 | 0 | 0 | 0.0 | 0.2 | 86 | New | ||
| Total | 14 | 46,818 | |||||||
All comparisons in vote share are to the corresponding 1991 election.
Ward results
Billericay East
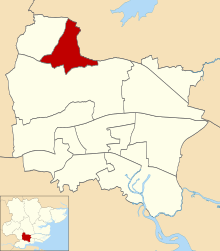
Location of Billericay East ward
| Party | Candidate | Votes | % | |
|---|---|---|---|---|
| Liberal Democrats | F. Bellard | 1,499 | 42.1% | |
| Conservative | B. Lea | 1,323 | 37.1% | |
| Labour | P. Clark | 742 | 20.8% | |
| Turnout | 40.3% | |||
| Liberal Democrats gain from Conservative | ||||
Billericay West
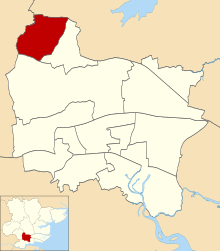
Location of Billericay West ward
| Party | Candidate | Votes | % | |
|---|---|---|---|---|
| Liberal Democrats | J. Macpherson | 1,876 | 46.1% | |
| Conservative | F. Tomlin | 1,673 | 41.1% | |
| Labour | R. Bessell | 524 | 12.9% | |
| Turnout | 40.2% | |||
| Liberal Democrats gain from Conservative | ||||
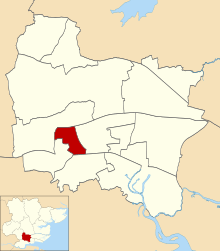
Burstead
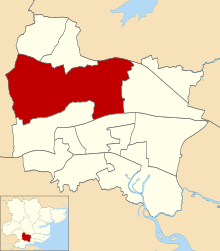
Location of Burstead ward
| Party | Candidate | Votes | % | |
|---|---|---|---|---|
| Liberal Democrats | G. Bellard | 1,451 | 43.0% | |
| Conservative | G. Buckenham | 1,291 | 38.3% | |
| Labour | A. Lockyer | 631 | 18.7% | |
| Turnout | 39.4% | |||
| Liberal Democrats gain from Conservative | ||||
Fryerns Central
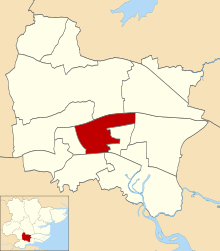
Location of Fryerns Central ward
| Party | Candidate | Votes | % | |
|---|---|---|---|---|
| Labour | P. Charles | 2,513 | 77.7% | |
| Conservative | W. Marck | 442 | 13.7% | |
| Liberal Democrats | K. Tyson | 280 | 8.7% | |
| Turnout | 40.5% | |||
| Labour hold | ||||
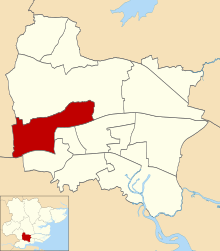
Fryerns East
Location of Fryerns East ward
| Party | Candidate | Votes | % | |
|---|---|---|---|---|
| Labour | A. Dove | 2,214 | 77.1% | |
| Conservative | S. Evens | 408 | 14.2% | |
| Liberal Democrats | J. Lutton | 250 | 8.7% | |
| Turnout | 37.1% | |||
| Labour hold | ||||
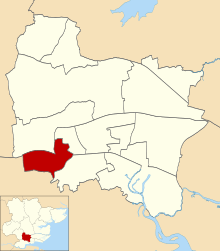
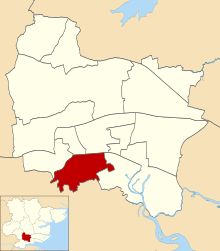
Laindon
Location of Laindon ward
| Party | Candidate | Votes | % | |
|---|---|---|---|---|
| Labour | T. Weldon | 2,027 | 56.1% | |
| Conservative | V. York | 1,271 | 35.2% | |
| Liberal Democrats | M. Martin | 313 | 8.7% | |
| Turnout | 40.4% | |||
| Labour gain from Conservative | ||||
Langdon Hills
Location of Langdon Hills ward
| Party | Candidate | Votes | % | |
|---|---|---|---|---|
| Labour | R. Sears | 2,103 | 57.4% | |
| Conservative | S. Horgan | 1,232 | 33.6% | |
| Liberal Democrats | S. Evans | 327 | 8.9% | |
| Turnout | 40.1% | |||
| Labour gain from Conservative | ||||
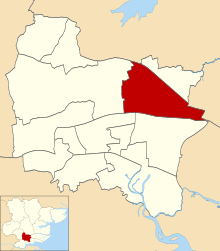
Lee Chapel North
Location of Lee Chapel North ward
| Party | Candidate | Votes | % | |
|---|---|---|---|---|
| Labour | L. Gordon | 2,467 | 79.5% | |
| Conservative | M. Amson | 638 | 20.5% | |
| Turnout | 41.0% | |||
| Labour hold | ||||
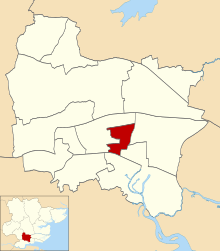
Nethermayne
Location of Nethermayne ward
| Party | Candidate | Votes | % | |
|---|---|---|---|---|
| Liberal Democrats | J. White | 1,548 | 43.6% | |
| Conservative | S. Caira-Neeson | 1,362 | 38.4% | |
| Labour | S. Elliott | 640 | 18.0% | |
| Turnout | 51.3% | |||
| Liberal Democrats hold | ||||
Pitsea East
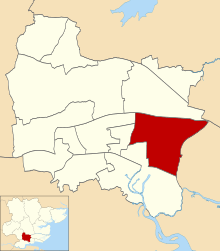
Location of Pitsea East ward
| Party | Candidate | Votes | % | |
|---|---|---|---|---|
| Labour | C. Alderson | 2,045 | 62.7% | |
| Conservative | R. Sheridan | 841 | 25.8% | |
| Liberal Democrats | D. Neale | 289 | 8.9% | |
| Militant (Trotskyist group) | D. Murray | 86 | 2.6% | |
| Turnout | 30.5% | |||
| Labour gain from Conservative | ||||
Pitsea West
Location of Pitsea West ward
| Party | Candidate | Votes | % | |
|---|---|---|---|---|
| Labour | D. Abrahall | 2,090 | 76.7% | |
| Conservative | H. Marshall | 425 | 15.6% | |
| Liberal Democrats | L. Williams | 210 | 7.7% | |
| Turnout | 32.0% | |||
| Labour hold | ||||
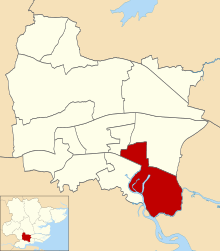
Vange
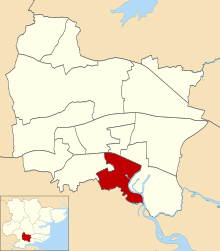
Location of Vange ward
| Party | Candidate | Votes | % | |
|---|---|---|---|---|
| Labour | M. Bruce | 1,894 | 76.8% | |
| Conservative | S. Hillier | 385 | 15.6% | |
| Liberal Democrats | F. Thomas | 186 | 7.5% | |
| Turnout | 32.7% | |||
| Labour hold | ||||
Wickford North
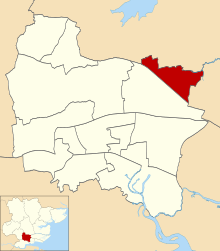
Location of Wickford North ward
| Party | Candidate | Votes | % | |
|---|---|---|---|---|
| Liberal Democrats | C. Sweeney | 1,432 | 38.6% | |
| Conservative | A. Sharpe | 1,226 | 33.0% | |
| Labour | C. Wilson | 1,056 | 28.4% | |
| Turnout | 40.0% | |||
| Liberal Democrats gain from Conservative | ||||
Wickford South
Location of Wickford South ward
| Party | Candidate | Votes | % | |
|---|---|---|---|---|
| Liberal Democrats | A. Banton | 1,333 | 36.9% | |
| Conservative | D. Morris | 1,329 | 36.8% | |
| Labour | B. Sime | 946 | 26.2% | |
| Turnout | 36.5% | |||
| Liberal Democrats hold | ||||
gollark: Theory: all Krist addresses are now controlled by Terrariola.
gollark: This is why we should have 1024-bit Krist addresses.
gollark: I think so. Discord is very bad about making usable sane UIs and loves making them "fun" and killing usability.
gollark: So it seems that most of them are just people trying to run a banned program classified "Siri" a few thousand times, but there also seems to have been someone misusing an OmniDisk™.
gollark: I've *just* checked the PotatOS SPUDNET report logs and it's >12000 items long for some reason?!
References
- "Council compositions by year". The Elections Centre.
- "Local Election Summaries 1995". The Elections Centre.
- "Basildon District Council Election Results 1973–2012" (PDF). Elections Centre. Retrieved 3 August 2019.
| Metropolitan boroughs |
|
|---|---|
| Unitary authorities |
|
| District councils |
|
| Welsh councils |
|
| Scottish councils |
|
This article is issued from Wikipedia. The text is licensed under Creative Commons - Attribution - Sharealike. Additional terms may apply for the media files.