2019 Welwyn Hatfield Borough Council election
Elections to Welwyn Hatfield Borough Council took place on 2 May 2019. This was on the same day as other local elections across the United Kingdom.[1]
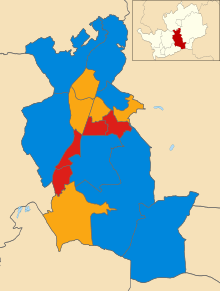
Map showing the winner in each ward for the 2019 Welwyn Hatfield Borough Council election
Results
| 2019 Welwyn Hatfield Borough Council election | ||||||||||
|---|---|---|---|---|---|---|---|---|---|---|
| Party | This election | Full council | This election | |||||||
| Seats | Net | Seats % | Other | Total | Total % | Votes | Votes % | +/− | ||
| Conservative | 8 | 44.4 | 15 | 23 | 47.9 | 11,341 | 38.8 | |||
| Labour | 5 | 27.8 | 8 | 13 | 27.1 | 7,419 | 25.4 | |||
| Liberal Democrats | 5 | 27.8 | 7 | 12 | 25.0 | 9,397 | 32.2 | |||
| Green | 0 | 0.0 | 0 | 0 | 0.0 | 733 | 2.5 | New | ||
| UKIP | 0 | 0.0 | 0 | 0 | 0.0 | 303 | 1.0 | New | ||
No Independent (-4.6) or Abolish the Town Council (-0.7) candidates as previous.
Ward results
Brookmans Park and Little Heath
| Party | Candidate | Votes | % | ± | |
|---|---|---|---|---|---|
| Conservative | Jonathan Stephen Findlay Boulton | 1,253 | 67.8 | ||
| Liberal Democrats | Louisa Beth Noel | 376 | 20.4 | ||
| Labour | Graham Martyn Beevers | 218 | 11.8 | ||
| Majority | 877 | 47.4 | — | ||
| Turnout | 1,878 | 37.5 | — | ||
| Conservative hold | Swing | ||||
Haldens
| Party | Candidate | Votes | % | ± | |
|---|---|---|---|---|---|
| Conservative | Barbara Ann Fitzsimmon | 568 | 35.8 | ||
| Labour | Jason Lee Robinson | 514 | 32.4 | ||
| Liberal Democrats | Darrell Rodney Panter | 341 | 21.5 | ||
| Green | Berenice Constance Mary Dowlen | 164 | 10.3 | N/A | |
| Majority | 54 | 3.4 | — | ||
| Turnout | 1,612 | 32.4 | — | ||
| Conservative hold | Swing | ||||
Handside
| Party | Candidate | Votes | % | ± | |
|---|---|---|---|---|---|
| Liberal Democrats | Anthony Dennis | 1,488 | 58.7 | ||
| Conservative | Chieme Okuzu | 667 | 26.3 | ||
| Labour | Martin Paul Norman | 202 | 8.0 | ||
| Green | Ian Nicholas Challoner Nendick | 178 | 7.0 | N/A | |
| Majority | 821 | 32.4 | — | ||
| Turnout | 2,561 | 46.8 | — | ||
| Liberal Democrats gain from Conservative | Swing | ||||
Hatfield Central
| Party | Candidate | Votes | % | ± | |
|---|---|---|---|---|---|
| Labour | Glyn Charles Hayes | 582 | 45.1 | ||
| Conservative | James Bond | 435 | 33.7 | ||
| Liberal Democrats | Adam Edwards | 274 | 21.2 | ||
| Majority | 147 | 11.4 | — | ||
| Turnout | 1,315 | 24.3 | — | ||
| Labour hold | Swing | ||||
Hatfield East
| Party | Candidate | Votes | % | ± | |
|---|---|---|---|---|---|
| Conservative | Caron Anne Juggins | 623 | 33.5 | ||
| Conservative | Edward Frederick Findlay Boulton | 584 | |||
| Liberal Democrats | Jackie Brennan | 553 | 29.8 | ||
| Labour | Phil Knott | 524 | 28.2 | ||
| Liberal Democrats | Gemma May Louise Moore | 467 | |||
| Labour | Cathy Watson | 450 | |||
| Green | Ian Howard Gregory | 157 | 8.5 | N/A | |
| Majority | 31 | 3.7 | — | ||
| Turnout | 33.2 | — | |||
| Conservative hold | Swing | ||||
| Conservative hold | Swing | ||||
Hatfield South West
| Party | Candidate | Votes | % | ± | |
|---|---|---|---|---|---|
| Labour | Lenny Brandon | 629 | 46.9 | ||
| Labour | James Robert Alan Broach | 544 | |||
| Liberal Democrats | Simon John Archer | 370 | 27.6 | ||
| Conservative | Jack Adams | 341 | 25.4 | ||
| Liberal Democrats | Paul Graham Wilson | 322 | |||
| Conservative | Aaron Steven Edward Jacob | 295 | |||
| Majority | 174 | 19.3 | — | ||
| Turnout | 1,466 | 27.9 | — | ||
| Labour hold | Swing | ||||
| Labour hold | Swing | ||||
Hatfield Villages
| Party | Candidate | Votes | % | ± | |
|---|---|---|---|---|---|
| Conservative | Drew Robert Richardson | 654 | 45.3 | ||
| Labour | Margaret Anne Eames-Peterses | 573 | 39.7 | ||
| Liberal Democrats | Matthew John Quenet | 218 | 15.1 | ||
| Majority | 71 | 5.6 | — | ||
| Turnout | 1,467 | 27.2 | — | ||
| Conservative hold | Swing | ||||
Hollybush
| Party | Candidate | Votes | % | ± | |
|---|---|---|---|---|---|
| Labour | Margaret Birleson | 620 | 47.9 | ||
| Conservative | Anthony James Musk | 492 | 38.0 | ||
| Liberal Democrats | Chris Corbey-West | 183 | 14.1 | ||
| Majority | 128 | 9.9 | — | ||
| Turnout | 1,330 | 27.2 | — | ||
| Labour hold | Swing | ||||
Howlands
| Party | Candidate | Votes | % | ± | |
|---|---|---|---|---|---|
| Labour | Jill Weston | 696 | 43.4 | ||
| Conservative | Stan Tunstall | 523 | 32.6 | ||
| UKIP | Darren Hughes | 193 | 12.0 | N/A | |
| Liberal Democrats | Konrad Basch | 191 | 11.9 | ||
| Majority | 173 | 10.8 | — | ||
| Turnout | 1,618 | 30.8 | — | ||
| Labour hold | Swing | ||||
Northaw and Cuffley
| Party | Candidate | Votes | % | ± | |
|---|---|---|---|---|---|
| Conservative | George Michaelides | 1,012 | 68.5 | ||
| Liberal Democrats | Robina Helen Durrant | 335 | 22.7 | ||
| Labour | Sheila Ann Barrett | 131 | 9.9 | ||
| Majority | 677 | 45.8 | — | ||
| Turnout | 1,502 | 31.8 | — | ||
| Conservative hold | Swing | — | |||
Panshanger
| Party | Candidate | Votes | % | ± | |
|---|---|---|---|---|---|
| Liberal Democrats | Jane Quinton | 784 | 48.8 | ||
| Conservative | Iain Grady Mansfield | 587 | 36.5 | ||
| Labour | Kyle Anthony MacLeod | 237 | 14.7 | ||
| Majority | 197 | 12.3 | — | ||
| Turnout | 1,629 | 36.5 | — | ||
| Liberal Democrats gain from Conservative | Swing | ||||
Peartree
| Party | Candidate | Votes | % | ± | |
|---|---|---|---|---|---|
| Liberal Democrats | Jayne Lesley Ranshaw | 623 | 50.4 | ||
| Labour | Steve Roberts | 402 | 32.6 | ||
| Conservative | Tony Bailey | 210 | 17.0 | ||
| Majority | 221 | 17.8 | — | ||
| Turnout | 1,258 | 26.1 | — | ||
| Liberal Democrats gain from Labour | Swing | ||||
Sherrards
| Party | Candidate | Votes | % | ± | |
|---|---|---|---|---|---|
| Liberal Democrats | Frank Annibale Stefano Marchio Marsh | 921 | 46.5 | ||
| Conservative | Pat Mabbott | 595 | 30.1 | ||
| Labour | Hilary Louise Carlen | 245 | 12.4 | ||
| UKIP | Paul Joseph Naughton | 110 | 5.6 | N/A | |
| Green | Lesley Jean Smith | 108 | 5.5 | N/A | |
| Majority | 326 | 16.4 | — | ||
| Turnout | 1,986 | 44.2 | — | ||
| Liberal Democrats gain from Conservative | Swing | ||||
Welham Green and Hatfield South
| Party | Candidate | Votes | % | ± | |
|---|---|---|---|---|---|
| Liberal Democrats | Jaida Esin Caliskan | 883 | 47.0 | ||
| Conservative | Darren Malcolm Bennett | 599 | 31.9 | ||
| Labour | John Richard Eames-Petersen | 393 | 21.0 | ||
| Majority | 284 | 15.1 | — | ||
| Turnout | 1,623 | 30.5 | — | ||
| Liberal Democrats hold | Swing | ||||
Welwyn East
| Party | Candidate | Votes | % | ± | |
|---|---|---|---|---|---|
| Conservative | Roger Trigg | 905 | 51.4 | ||
| Liberal Democrats | Helen Harrington | 511 | 29.0 | ||
| Labour | Josh Chigwangwa | 343 | 19.5 | ||
| Majority | 394 | 22.4 | — | ||
| Turnout | 1,801 | 35.5 | — | ||
| Conservative hold | Swing | ||||
Welwyn West
| Party | Candidate | Votes | % | ± | |
|---|---|---|---|---|---|
| Conservative | Tony Kingsbury | 998 | 55.5 | ||
| Liberal Democrats | Christina Maria Raven | 557 | 31.0 | N/A | |
| Green | Tim Hogan | 126 | 7.0 | N/A | |
| Labour | Ian Merison | 116 | 6.5 | ||
| Majority | 213 | 13.2 | — | ||
| Turnout | 1,812 | 37.2 | — | ||
| Conservative hold | Swing | ||||
gollark: I would probably just go for automatically generated machine-readable changelogs of some form.
gollark: *Currently* I can't do half of those because there's no actual versioning mechanism, and no way to compile stuff because it is all run straight off pastebin.
gollark: Having version control would probably make some potatOS things I've wanted possible, such as verified boot where potatOS ensures that the currently installed stuff matches a checksum, compressed updates, and updates which work if I change a non-core file (the updater logic is very weird).
gollark: And I think cloud catcher.
gollark: Monaco is the one VSCode uses.
References
- "Welwyn Hatfield Borough Council Election". Retrieved 13 May 2019.
- "Election Results - 3 May 2019". Retrieved 13 May 2019.
This article is issued from Wikipedia. The text is licensed under Creative Commons - Attribution - Sharealike. Additional terms may apply for the media files.