1988 Harlow District Council election
The 1988 Harlow District Council election took place on 5 May 1988 to elect members of Harlow District Council in Essex, England. This was on the same day as other local elections. The Labour Party retained control of the council.
| |||||||||||||||||||||||||||||||||||||
14 of the 42 seats to Harlow District Council 22 seats needed for a majority | |||||||||||||||||||||||||||||||||||||
|---|---|---|---|---|---|---|---|---|---|---|---|---|---|---|---|---|---|---|---|---|---|---|---|---|---|---|---|---|---|---|---|---|---|---|---|---|---|
| |||||||||||||||||||||||||||||||||||||
 Map showing the results of contested wards in the 1988 Harlow District Council elections. | |||||||||||||||||||||||||||||||||||||
| |||||||||||||||||||||||||||||||||||||
Election result
| Party | Seats | Gains | Losses | Net gain/loss | Seats % | Votes % | Votes | +/− | |
|---|---|---|---|---|---|---|---|---|---|
| Labour | 11 | 0 | 1 | 78.6 | 60.1 | 12,227 | |||
| Conservative | 2 | 1 | 0 | 14.3 | 29.7 | 6,054 | |||
| SLD | 1 | 0 | 0 | 7.1 | 9.9 | 2,022 | |||
| Independent | 0 | 0 | 0 | 0.0 | 0.3 | 58 | New | ||
All comparisons in vote share are to the corresponding 1984 election.
Ward results
Brays Grove
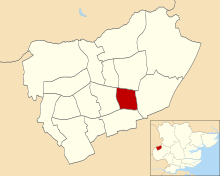
Location of Brays Grove ward
| Party | Candidate | Votes | % | |
|---|---|---|---|---|
| Labour | D. Burnham | 835 | 76.7% | |
| Conservative | D. Messer | 254 | 23.3% | |
| Turnout | 33.8% | |||
| Labour hold | ||||
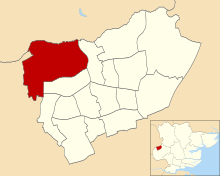
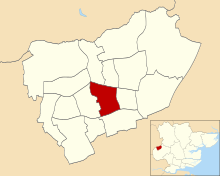
Great Parndon
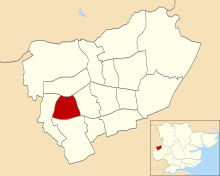
Location of Great Parndon ward
| Party | Candidate | Votes | % | |
|---|---|---|---|---|
| Conservative | L. Atkins | 820 | 48.5% | |
| Labour | J. Sanders | 705 | 41.7% | |
| SLD | D. Harris | 106 | 6.3% | |
| Independent | S. Ford | 58 | 3.4% | |
| Turnout | 51.1% | |||
| Conservative hold | ||||
Hare Street and Town Centre
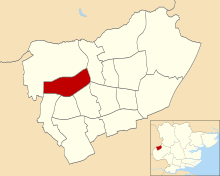
Location of Hare Street and Town Centre ward
| Party | Candidate | Votes | % | |
|---|---|---|---|---|
| Labour | J. Hobbs | 758 | 75.2% | |
| Conservative | D. Groves | 250 | 24.8% | |
| Turnout | 35.6% | |||
| Labour hold | ||||
Kingsmoor
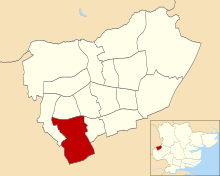
Location of Kingsmoor ward
| Party | Candidate | Votes | % | |
|---|---|---|---|---|
| Conservative | S. Rigden | 841 | 46.0% | |
| Labour | J. Young | 820 | 44.8% | |
| SLD | D. Collins | 168 | 9.2% | |
| Turnout | 38.3% | |||
| Conservative gain from Labour | ||||
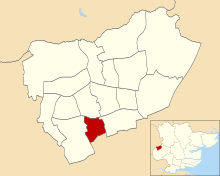
Latton Bush
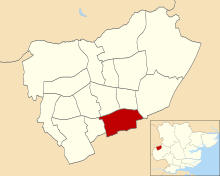
Location of Latton Bush ward
| Party | Candidate | Votes | % | |
|---|---|---|---|---|
| Labour | A. Jones | 1,052 | 69.5% | |
| Conservative | S. Cross | 461 | 30.5% | |
| Turnout | 36.7% | |||
| Labour hold | ||||
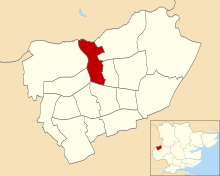
Little Parndon
Location of Little Parndon ward
| Party | Candidate | Votes | % | |
|---|---|---|---|---|
| Labour | D. Condon | 975 | 65.0 | |
| Conservative | K. Smart | 355 | 23.7% | |
| SLD | L. Spenceley | 171 | 11.4% | |
| Labour hold | ||||
Mark Hall South
Location of Mark Hall South ward
| Party | Candidate | Votes | % | |
|---|---|---|---|---|
| Labour | T. Farr | 1,061 | 69.7% | |
| Conservative | N. Hitch | 333 | 21.9% | |
| SLD | N. Armitage | 129 | 8.5% | |
| Turnout | 38.9% | |||
| Labour hold | ||||
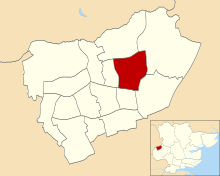
Netteswell East
Location of Netteswell East ward
| Party | Candidate | Votes | % | |
|---|---|---|---|---|
| Labour | P. Balbi | 727 | 65.2% | |
| Conservative | M. Rigden | 260 | 23.3% | |
| SLD | V. Scott | 128 | 11.5% | |
| Turnout | 38.5% | |||
| Labour hold | ||||
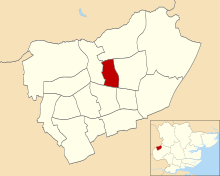
Netteswell West
Location of Netteswell West ward
| Party | Candidate | Votes | % | |
|---|---|---|---|---|
| Labour | M. Coleman | 618 | 64.6% | |
| Conservative | S. Jones | 215 | 22.5% | |
| SLD | S. Herbert | 123 | 12.9% | |
| Turnout | 37.7% | |||
| Labour hold | ||||
Old Harlow
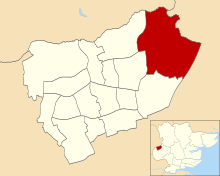
Location of Old Harlow ward
| Party | Candidate | Votes | % | |
|---|---|---|---|---|
| Labour | R. Howitt | 1,243 | 48.7% | |
| Conservative | S. Carter | 1,151 | 45.1% | |
| SLD | P. Barton | 156 | 6.1% | |
| Turnout | 55.7% | |||
| Labour hold | ||||
Passmores
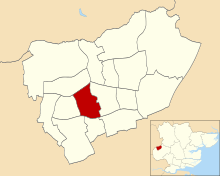
Location of Passmores ward
| Party | Candidate | Votes | % | |
|---|---|---|---|---|
| Labour | J. Rogers | 859 | 61.8% | |
| Conservative | M. Tombs | 381 | 27.4% | |
| SLD | A. Curran | 149 | 10.7% | |
| Turnout | 35.0% | |||
| Labour hold | ||||
Potter Street
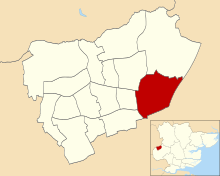
Location of Potter Street ward
| Party | Candidate | Votes | % | |
|---|---|---|---|---|
| Labour | R. Brown | 970 | 71.5% | |
| Conservative | D. Fleming | 244 | 18.0% | |
| SLD | S. Ward | 142 | 10.5% | |
| Turnout | 41.2% | |||
| Labour hold | ||||
Stewards
Location of Stewards ward
| Party | Candidate | Votes | % | |
|---|---|---|---|---|
| SLD | S. Curran | 750 | 50.7% | |
| Labour | C. Downing | 560 | 37.9% | |
| Conservative | K. Jones | 168 | 11.4% | |
| Turnout | 37.6% | |||
| SLD hold | ||||
Tye Green
Location of Tye Green ward
| Party | Candidate | Votes | % | |
|---|---|---|---|---|
| Labour | V. Phelps | 1,044 | 76.5% | |
| Conservative | B. Hill | 321 | 23.5% | |
| Turnout | 36.9% | |||
| Labour hold | ||||
gollark: My website is a PWA. I just shoved on a service worker and manifest file.
gollark: Hmm, yes, fair. I don't think the experimental P2P stuff has been very successful.
gollark: Matrix?
gollark: Thus, offline mode ish.
gollark: PWAs are great. My mostly static website is technically considered a PWA because I added a service worker.
References
- "Council compositions by year". The Elections Centre.
- "Local Election Summaries 1988". The Elections Centre.
- "Harlow District Council Election Results 1973-2012" (PDF). Elections Centre. Retrieved 27 September 2019.
| Metropolitan boroughs |
|
|---|---|
| District councils (England) |
|
| District councils (Scotland) |
|
This article is issued from Wikipedia. The text is licensed under Creative Commons - Attribution - Sharealike. Additional terms may apply for the media files.