2000 Basildon District Council election
The 2000 Basildon District Council election took place on 4 May 2000 to elect members of Basildon District Council in Essex, England. One third of the council was up for election and the Labour party lost overall control of the council to no overall control.[3]
| |||||||||||||||||||||||||||||||||
15 of the 42 seats to Basildon District Council 22 seats needed for a majority | |||||||||||||||||||||||||||||||||
|---|---|---|---|---|---|---|---|---|---|---|---|---|---|---|---|---|---|---|---|---|---|---|---|---|---|---|---|---|---|---|---|---|---|
| |||||||||||||||||||||||||||||||||
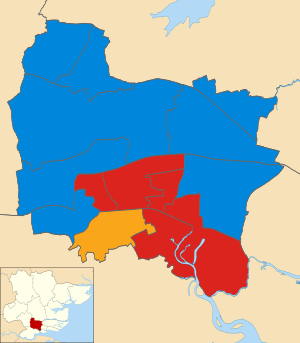 Map showing the results of contested wards in the 2000 Basildon Borough Council elections. | |||||||||||||||||||||||||||||||||
| |||||||||||||||||||||||||||||||||
After the election, the composition of the council was
- Labour 20
- Conservative 18
- Liberal Democrats 4[4]
Election result
The results saw the Conservatives make gains from both Labour and Liberal Democrats[5] to go from 11 to 18 seats on the council.[6] This deprived Labour of a majority on the council after 5 years[5] and reduced Labour's lead over the Conservatives to just 2 seats.[6] Meanwhile, the Liberal Democrats lost half their seats to fall to have just 4 councillors,[6] but were left with the balance of power.[5]
The Conservatives gained marginal seats in Basildon from Labour including Laindon, Langdon Hills and Pitsea East.[6] They also took all the seats the Liberal Democrats had been defending in Billericay and Wickford.[6]
Following the election the Liberal Democrat leader Geoff Williams said "issues will be decided on their merit and not on party politics".[6]
| Party | Seats | Gains | Losses | Net gain/loss | Seats % | Votes % | Votes | +/− | |
|---|---|---|---|---|---|---|---|---|---|
| Conservative | 8 | 6 | 0 | 53.3 | 52.8 | 16,705 | |||
| Labour | 6 | 0 | 3 | 40.0 | 29.5 | 9,333 | |||
| Liberal Democrats | 1 | 0 | 3 | 6.7 | 16.2 | 5,120 | |||
| Independent | 0 | 0 | 0 | 0.0 | 1.4 | 447 | New | ||
| Socialist Alternative | 0 | 0 | 0 | 0.0 | 0.1 | 37 | New | ||
All comparisons in vote share are to the corresponding 1996 election.
Ward results
Billericay East
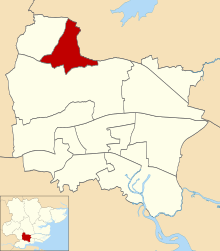
| Party | Candidate | Votes | % | |
|---|---|---|---|---|
| Conservative | John Alabaster[9] | 1,675 | 66.3% | |
| Liberal Democrats | F. Bellard | 583 | 23.1% | |
| Labour | P. Reid | 269 | 10.6% | |
| Turnout | 28.4% | |||
| Conservative gain from Liberal Democrats | ||||
Billericay West
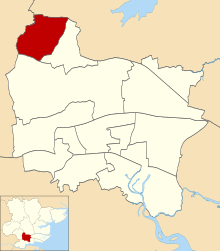
| Party | Candidate | Votes | % | |
|---|---|---|---|---|
| Conservative | Anthony Hedley[10] | 2,022 | 66.7% | |
| Liberal Democrats | G. Taylor | 800 | 26.4% | |
| Labour | L. Howard | 210 | 6.9% | |
| Turnout | 28.6% | |||
| Conservative gain from Liberal Democrats | ||||
Burstead
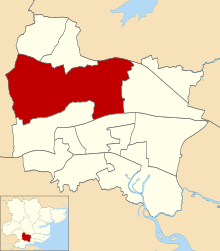
| Party | Candidate | Votes | % | |
|---|---|---|---|---|
| Conservative | Christopher Jackman[11] | 1,551 | 64.3% | |
| Liberal Democrats | G. Bellard | 542 | 22.5% | |
| Labour | M. Viney | 319 | 13.2% | |
| Turnout | 27.9% | |||
| Conservative hold | ||||
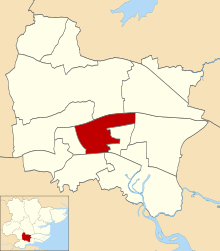
Fryerns Central
| Party | Candidate | Votes | % | |
|---|---|---|---|---|
| Labour | Julia Palmer[12] | 946 | 53.8% | |
| Conservative | W. Marck | 558 | 31.7% | |
| Liberal Democrats | S. Dickinson | 255 | 14.5% | |
| Turnout | 22.4% | |||
| Labour hold | ||||
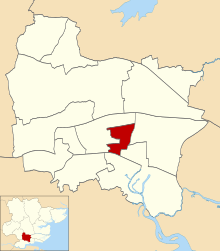
Fryerns East
| Party | Candidate | Votes | % | |
|---|---|---|---|---|
| Labour | Janet Payn[13] | 737 | ||
| Labour | Anthony Borlase[13] | 703 | ||
| Conservative | D. Allen | 519 | ||
| Conservative | R. Hyland | 410 | ||
| Liberal Democrats | J. Lutton | 194 | ||
| Turnout | 19.2% | |||
| Labour hold | ||||
| Labour hold | ||||
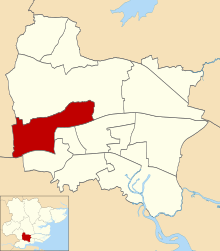
Laindon
| Party | Candidate | Votes | % | |
|---|---|---|---|---|
| Labour | Stuart Allen[14] | 1,299 | 48.9% | |
| Conservative | W. Aitken | 1,003 | 37.8% | |
| Liberal Democrats | V. Howard | 276 | 10.4% | |
| Independent | A. Viccary | 76 | 2.9% | |
| Turnout | 26.7% | |||
| Conservative gain from Labour | ||||
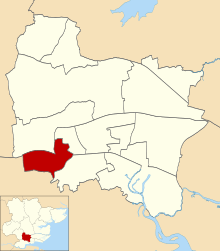
Langdon Hills
| Party | Candidate | Votes | % | |
|---|---|---|---|---|
| Conservative | Stephen Hillier[15] | 1,609 | 60.6% | |
| Labour | P. Garrad | 725 | 27.3% | |
| Liberal Democrats | M. Hersom | 218 | 8.2% | |
| Independent | J. Richardson | 67 | 2.5% | |
| Socialist Alternative | D. Murray | 37 | 1.4% | |
| Turnout | 26.8% | |||
| Conservative gain from Labour | ||||
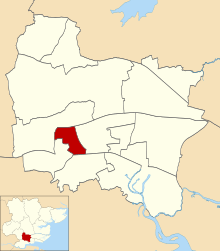
Lee Chapel North
| Party | Candidate | Votes | % | |
|---|---|---|---|---|
| Labour | D. Keefe | 820 | 45.3% | |
| Conservative | S. Cleasby | 632 | 34.9% | |
| Liberal Democrats | S. Williams | 171 | 9.4% | |
| Independent | S. Chaney | 123 | 6.8% | |
| Independent | M. Dale | 64 | 3.5% | |
| Turnout | 24.3% | |||
| Labour hold | ||||
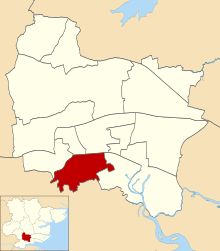
Nethermayne
| Party | Candidate | Votes | % | |
|---|---|---|---|---|
| Liberal Democrats | Ben Williams[16] | 1,067 | 45.5% | |
| Conservative | D. Walsh | 647 | 27.6% | |
| Labour | A. Manning | 631 | 26.9% | |
| Turnout | 34.2% | |||
| Liberal Democrats hold | ||||
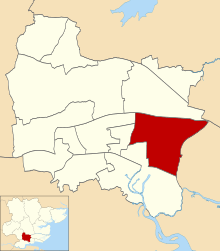
Pitsea East
| Party | Candidate | Votes | % | |
|---|---|---|---|---|
| Conservative | Kevin Blake[17] | 1,225 | 51.8% | |
| Labour | K. Woods | 1,024 | 43.3% | |
| Independent | N. Richardson | 117 | 4.9% | |
| Turnout | 22.5% | |||
| Conservative gain from Labour | ||||
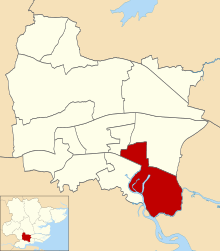
Pitsea West
| Party | Candidate | Votes | % | |
|---|---|---|---|---|
| Labour | Richard Llewellyn[18] | 919 | 57.6% | |
| Conservative | B. Larwood | 677 | 42.4% | |
| Turnout | 19.7% | |||
| Labour hold | ||||
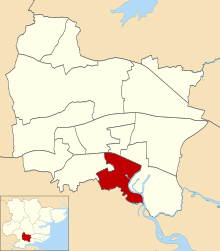
Vange
| Party | Candidate | Votes | % | |
|---|---|---|---|---|
| Labour | Phil Rackley[19] | 645 | 48.1% | |
| Conservative | G. Johnson | 528 | 39.3% | |
| Liberal Democrats | L. Williams | 169 | 12.6% | |
| Turnout | 17.3% | |||
| Labour hold | ||||
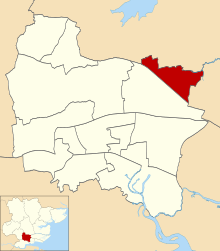
Wickford North
| Party | Candidate | Votes | % | |
|---|---|---|---|---|
| Conservative | Carole Morris[20] | 1,669 | 64.1% | |
| Labour | C. Wilson | 515 | 19.8% | |
| Liberal Democrats | I. Robertson | 419 | 16.1% | |
| Turnout | 28.1% | |||
| Conservative gain from Liberal Democrats | ||||
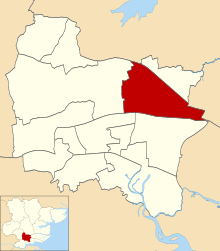
Wickford South
| Party | Candidate | Votes | % | |
|---|---|---|---|---|
| Conservative | Malcolm Buckley[21] | 2,094 | 67.8% | |
| Labour | A. Ede | 570 | 18.4% | |
| Liberal Democrats | W. Fane | 426 | 13.8% | |
| Turnout | 25.5% | |||
| Conservative hold | ||||
References
- "Council compositions by year". The Elections Centre.
- "Local Election Summaries 2000". The Elections Centre.
- "Basildon". BBC News Online. Retrieved 25 June 2011.
- "Election special: Results". The Guardian. 6 May 2000. p. 8.
- "South Essex: Tories back in Southend after six years". Southend Standard. 5 May 2000. Retrieved 25 June 2011.
- "Election round-up: Labour lose control in Basildon". Southend Standard. 5 May 2000. Retrieved 25 June 2011.
- "Election results: local councils". The Times. 6 May 2000. p. 10.
- "Basildon District Council Election Results 1973–2012" (PDF). Elections Centre. Retrieved 3 August 2019.
- "Billericay East". Basildon District Council. Archived from the original on 25 May 2001. Retrieved 12 October 2019.
- "Billericay West". Basildon District Council. Archived from the original on 18 November 2001. Retrieved 12 October 2019.
- "Burstead". Basildon District Council. Archived from the original on 7 July 2001. Retrieved 12 October 2019.
- "Fryerns Central". Basildon District Council. Archived from the original on 24 February 2002. Retrieved 12 October 2019.
- "Fryerns East". Basildon District Council. Archived from the original on 25 May 2001. Retrieved 12 October 2019.
- "Laindon". Basildon District Council. Archived from the original on 25 May 2001. Retrieved 12 October 2019.
- "Langdon Hills". Basildon District Council. Archived from the original on 25 May 2001. Retrieved 12 October 2019.
- "Nethermayne". Basildon District Council. Archived from the original on 25 May 2001. Retrieved 12 October 2019.
- "Pitsea East". Basildon District Council. Archived from the original on 25 May 2001. Retrieved 12 October 2019.
- "Pitsea West". Basildon District Council. Archived from the original on 25 May 2001. Retrieved 12 October 2019.
- "Vange". Basildon District Council. Archived from the original on 24 May 2001. Retrieved 12 October 2019.
- "Wickford North". Basildon District Council. Archived from the original on 18 November 2001. Retrieved 12 October 2019.
- "Wickford South". Basildon District Council. Archived from the original on 6 October 2001. Retrieved 12 October 2019.