2019 North Hertfordshire District Council election
The 2019 North Hertforshire District Council election took place on 2 May 2019 to elect 16 of the 49 members of North Hertfordshire District Council in England.[1][2] This was on the same day as other local elections around the country. Heading into the election, the Conservative Party held a 4 seat majority. Although they still had 6 seats more than any other party after the result of the election, they lost their majority.
| |||||||||||||||||||||||||||||||||||||||||||||||||||||||||||||
16 of the 49 seats to North Hertfordshire District Council 25 seats needed for a majority | |||||||||||||||||||||||||||||||||||||||||||||||||||||||||||||
|---|---|---|---|---|---|---|---|---|---|---|---|---|---|---|---|---|---|---|---|---|---|---|---|---|---|---|---|---|---|---|---|---|---|---|---|---|---|---|---|---|---|---|---|---|---|---|---|---|---|---|---|---|---|---|---|---|---|---|---|---|---|
| |||||||||||||||||||||||||||||||||||||||||||||||||||||||||||||
| |||||||||||||||||||||||||||||||||||||||||||||||||||||||||||||
Summary Result
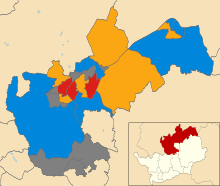
Map showing the winner in each ward for the 2019 North Hertfordshire District Council election
Where elections took place
The following table shows a summary of the results where elections took place.
| North Hertfordshire District Council election, 2019 [2][3][4] | |||||||||
|---|---|---|---|---|---|---|---|---|---|
| Party | Seats | Gains | Losses | Net gain/loss | Seats % |
Votes | Votes
% |
+/– | |
| Conservative | 7 | 0 | 7 | 43.75 | 9,380 | 35.67 | -4.38 | ||
| Liberal Democrat | 6 | 5 | 0 | 31.25 | 7,384 | 28.08 | +7.83 | ||
| Labour Party | 3 | 2 | 0 | 18.75 | 5,675 | 21.58 | -9.78 | ||
| Green Party | 0 | 0 | 0 | 0 | 2,757 | 10.48 | 3.49 | ||
| UKIP | 0 | 0 | 0 | 0 | 841 | 3.20 | +2.87 | ||
| Turnout | 26,296 | 36.27 | -4.14 | ||||||
Overall composition of district council
The following shows the composition and change of the district council overall as a result of the elections.
| North Hertfordshire District Council election, 2019 [2][3][4] | ||||||
|---|---|---|---|---|---|---|
| Party | Before | After | Change (seats) | |||
| Seats | Seats (%) | Seats | Seats (%) | |||
| Conservative | 29 | 59.18 | 22 | 44.90 | ||
| Labour Party | 14 | 28.57 | 16 | 32.65 | ||
| Liberal Democrat | 6 | 12.24 | 11 | 22.45 | ||
| Majority | ||||||
| No overall control gain from Conservative | ||||||
Ward Results
- Arbury
| Party | Candidate | Votes | % | ± | |
|---|---|---|---|---|---|
| Liberal Democrats | Tom Tyson | 570 | 50.98 | +39.53 | |
| Conservative | Chris Schwick | 453 | 40.51 | -23.40 | |
| Green | Tim Lee | 88 | 7.87 | +5.96 | |
| Turnout | 1,118 | 51.64 | -28.51 | ||
| Liberal Democrats gain from Conservative | Swing | ||||
- Baldock Town
| Party | Candidate | Votes | % | ± | |
|---|---|---|---|---|---|
| Conservative | Michael Muir | 941 | 51.36 | +3.45 | |
| Liberal Democrats | Rob Lambie | 350 | 19.10 | +19.10 | |
| Labour | Colwyn Griffiths | 321 | 17.52 | +2.71 | |
| Green | George Woolhouse | 201 | 10.97 | -0.38 | |
| Turnout | 1,832 | 31.96 | -33.03 | ||
| Conservative hold | |||||
- Cadwell
| Party | Candidate | Votes | % | ± | |
|---|---|---|---|---|---|
| Liberal Democrats | Sam North | 352 | 47.96 | ||
| Conservative | Michael Goddard | 207 | 28.20 | ||
| Labour | David De Smet | 95 | 12.94 | ||
| Green | Rosamund Mcguire | 72 | 9.81 | ||
| Turnout | 734 | 41.17 | |||
| Liberal Democrats gain from Conservative | Swing | ||||
- Chesfield
| Party | Candidate | Votes | % | ± | |
|---|---|---|---|---|---|
| Conservative | George Davies | 595 | 41.99 | ||
| Liberal Democrats | Keith Abrahams | 337 | 23.78 | ||
| Labour | Yusuf Mayet | 226 | 15.95 | ||
| Green | Mary Marshall | 220 | 15.53 | ||
| Turnout | 1,417 | 27.45 | |||
| Conservative hold | |||||
- Ermine
| Party | Candidate | Votes | % | ± | |
|---|---|---|---|---|---|
| Conservative | Gerald Morris | 492 | 59.21 | ||
| Liberal Democrats | Suzie Anderton | 187 | 22.50 | ||
| Green | Mark Gamon | 104 | 12.52 | ||
| Labour | Robin King | 40 | 4.81 | ||
| Turnout | 831 | 40.16 | |||
| Conservative hold | |||||
- Hitchin Bearton
| Party | Candidate | Votes | % | ± | |
|---|---|---|---|---|---|
| Labour | Judi Billing | 1157 | 53.69 | ||
| Liberal Democrats | Jonathan Claydon | 351 | 16.29 | ||
| Conservative | Gulshan Mangat | 328 | 15.22 | ||
| Green | Anni Sander | 296 | 13.74 | ||
| Turnout | 2155 | 34.45 | |||
| Labour hold | |||||
- Hitchin Highbury
| Party | Candidate | Votes | % | ± | |
|---|---|---|---|---|---|
| Liberal Democrats | Keith Hoskins | 1606 | 62.20 | ||
| Conservative | Leon Emirali | 534 | 20.68 | ||
| Labour | Angela Griggs | 244 | 9.45 | ||
| Green | Diana Newson | 181 | 7.01 | ||
| Turnout | 2582 | 41.94 | |||
| Liberal Democrats gain from Conservative | Swing | ||||
- Hitchin Walsworth
| Party | Candidate | Votes | % | ± | |
|---|---|---|---|---|---|
| Labour | Kay Tart | 994 | 44.38 | ||
| Conservative | Mark Russell | 570 | 25.45 | ||
| Green | William Lavin | 393 | 17.54 | ||
| Liberal Democrats | Ying Han | 255 | 11.38 | ||
| Turnout | 2240 | 37.12 | |||
| Labour gain from Conservative | Swing | ||||
- Hitchwood Offa & Hoo
| Party | Candidate | Votes | % | ± | |
|---|---|---|---|---|---|
| Conservative | David Barnard | 1149 | 54.71 | ||
| Green | Nicky Clark | 360 | 17.14 | ||
| Liberal Democrats | Marilyn Parkin | 305 | 14.52 | ||
| Labour | Anton Jungreuthmayer | 260 | 12.38 | ||
| Turnout | 2100 | 36.09 | |||
| Conservative hold | |||||
- Letchworth Grange
| Party | Candidate | Votes | % | ± | |
|---|---|---|---|---|---|
| Conservative | Morgan Derbyshire | 708 | 37.90 | ||
| Labour | Conor Brogan | 563 | 30.14 | ||
| UKIP | Steven Adelantado | 234 | 12.53 | ||
| Liberal Democrats | Josh Hamilton | 187 | 10.01 | ||
| Green | Sarah Cope | 172 | 9.21 | ||
| Turnout | 1868 | 34.40 | |||
| Conservative hold | |||||
- Letchworth South East
| Party | Candidate | Votes | % | ± | |
|---|---|---|---|---|---|
| Labour | Adem Ruggiero-Cakir | 796 | 43.31 | ||
| Conservative | Andrew Clare | 783 | 42.60 | ||
| UKIP | Sidney Start | 242 | 13.17 | ||
| Turnout | 1838 | 34.01 | |||
| Labour gain from Conservative | Swing | ||||
- Letchworth South West
| Party | Candidate | Votes | % | ± | |
|---|---|---|---|---|---|
| Liberal Democrats | Sean Prendergast | 800 | 34.60 | ||
| Conservative | Lynda Needham | 800 | 34.60 | ||
| Labour | Jean Andrews | 279 | 12.07 | ||
| UKIP | Wendy Gross | 218 | 9.43 | ||
| Green | Nicholas Newson | 201 | 8.69 | ||
| Turnout | 2312 | 38.88 | |||
| Liberal Democrats gain from Conservative | Swing | ||||
- Royston Heath
| Party | Candidate | Votes | % | ± | |
|---|---|---|---|---|---|
| Liberal Democrats | Carol Stanier | 963 | 54.19 | ||
| Conservative | Sarah Dingley | 538 | 30.28 | ||
| Green | Katherine Shann | 134 | 7.54 | ||
| Labour | Amy Bourke-Waite | 119 | 6.70 | ||
| Turnout | 1777 | 40.34 | |||
| Liberal Democrats gain from Conservative | Swing | ||||
- Royston Meridian
| Party | Candidate | Votes | % | ± | |
|---|---|---|---|---|---|
| Conservative | Tony Hunter | 699 | 47.26 | ||
| Liberal Democrats | Peter Rice | 340 | 22.99 | ||
| UKIP | Christopher Arquati | 147 | 9.94 | ||
| Labour | Stephen Lockett | 147 | 9.94 | ||
| Green | Karen Harmel | 140 | 9.47 | ||
| Turnout | 1479 | 35.92 | |||
| Conservative hold | |||||
- Royston Palace
| Party | Candidate | Votes | % | ± | |
|---|---|---|---|---|---|
| Conservative | Jean Green | 474 | 37.83 | ||
| Labour | Rob Inwood | 415 | 33.12 | ||
| Liberal Democrats | Amy Di Capite | 180 | 14.37 | ||
| Green | Angela Clark | 170 | 13.57 | ||
| Turnout | 1253 | 28.61 | |||
| Conservative hold | |||||
- Weston and Sandon
| Party | Candidate | Votes | % | ± | |
|---|---|---|---|---|---|
| Liberal Democrats | Steve Jarvis | 601 | 79.08 | ||
| Conservative | Michael Hearn | 109 | 14.34 | ||
| Green | Des Stephens | 25 | 3.29 | ||
| Labour | Headley Parkins | 19 | 2.50 | ||
| Turnout | 760 | 46.23 | |||
| Liberal Democrats hold | |||||
gollark: "oh yes, what a horrible mistake, we accidentally accessed too much data"
gollark: Although it did access steam friends lists without permission.
gollark: I looked into it, and apparently it's not *obviously* doing spying.
gollark: Which means they think they can make a lot of money through it, hence apiohazard.
gollark: karbonite system pollution
References
- "Upcoming elections - don't forget to vote on Thursday 2 May | North Hertfordshire District Council". www.north-herts.gov.uk. Retrieved 6 May 2019.
- "North Hertfordshire District Council". BBC News. Retrieved 6 May 2019.
- "Election Results 2015 | North Hertfordshire District Council". www.north-herts.gov.uk. Retrieved 6 May 2019.
- "Election Results 2019 | North Hertfordshire District Council". www.north-herts.gov.uk. Retrieved 6 May 2019.
This article is issued from Wikipedia. The text is licensed under Creative Commons - Attribution - Sharealike. Additional terms may apply for the media files.