2019 Bedford Borough Council election
The 2019 Bedford Borough Council election took place on 2 May 2019 to elect members of Bedford Borough Council in England.
| |||||||||||||||||||||||||||||||||||||||||||||||||||||||||||||||||||||||||||
All 40 seats to Bedford Borough Council 21 seats needed for a majority | |||||||||||||||||||||||||||||||||||||||||||||||||||||||||||||||||||||||||||
|---|---|---|---|---|---|---|---|---|---|---|---|---|---|---|---|---|---|---|---|---|---|---|---|---|---|---|---|---|---|---|---|---|---|---|---|---|---|---|---|---|---|---|---|---|---|---|---|---|---|---|---|---|---|---|---|---|---|---|---|---|---|---|---|---|---|---|---|---|---|---|---|---|---|---|---|
| |||||||||||||||||||||||||||||||||||||||||||||||||||||||||||||||||||||||||||
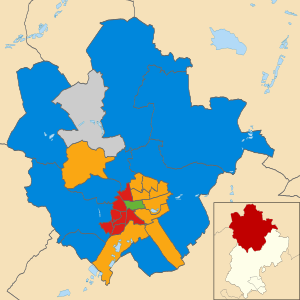 Map showing the winner in each ward for the 2019 Bedford Borough Council election | |||||||||||||||||||||||||||||||||||||||||||||||||||||||||||||||||||||||||||
| |||||||||||||||||||||||||||||||||||||||||||||||||||||||||||||||||||||||||||
Bedford Borough Council has been under no overall control since 2010. The Conservatives defended fifteen seats, Labour defended fourteen, the Liberal Democrats defended nine and independent councillors defended two seats. Bedford is run by the directly elected Mayor of Bedford, who has been Liberal Democrat Dave Hodgson since 2009.
Background
Bedford Borough Council will hold local elections on 2 May 2019 along with councils across England as part of the 2019 local elections. The council elects its members in all-out elections, with all its councillors up for election every four years.[1][2] Councillors defending their seats in this election were previously elected in 2015. In that election, fifteen Conservative councillors, fourteen Labour councillors, nine Labour councillors and two independent councillors were elected.
The same day Dave Hodgson (Liberal Democrat) was re-elected mayor in the 2019 Bedford Mayoral election.
Overall results
| Party | Seats | Gains | Losses | Net Gain/Loss | Seats % | Votes % | Votes | +/- |
|---|---|---|---|---|---|---|---|---|
| Liberal Democrat | 15 | 6 | 0 | +6 | 37.5 | 30.3 | 22,326 | +10.9 |
| Conservative | 11 | 0 | 4 | -4 | 27.5 | 31.3 | 23,010 | -8.4 |
| Labour | 11 | 1 | 4 | -3 | 27.5 | 27.6 | 20,325 | -0.1 |
| Green | 2 | 2 | 0 | +2 | 5 | 6.4 | 4,716 | +0.9 |
| Independent | 1 | 0 | 1 | -1 | 2.5 | 3.7 | 2,691 | +1.9 |
| UKIP | 0 | 0 | 0 | 0 | 0 | 0.5 | 394 | -4.5 |
| Renew | 0 | 0 | 0 | 0 | 0 | 0.2 | 161 | N/A |
Council Composition
Prior to the election the composition of the council was:
| 15 | 14 | 9 | 2 |
| Conservative | Labour | Liberal Democrats |
Ind |
After the election the composition of the council was:
| 15 | 11 | 11 | 2 | 1 |
| Liberal Democrat | Labour | Conservative | Green | Ind |
Ward results
Incumbent councillors are marked with an asterisk (*).
Brickhill
| Party | Candidate | Votes | % | ± | |
|---|---|---|---|---|---|
| Liberal Democrats | Wendy Rider* | 1,756 | 33 | +7 | |
| Liberal Democrats | Charles Royden* | 1,756 | 33 | +10 | |
| Conservative | Nigel Haughton | 524 | 10 | -5 | |
| Conservative | Matt Stanbra | 404 | 8 | -3 | |
| Labour | Cathrine Ward | 317 | 6 | -4 | |
| Labour | Sudesh Rani | 291 | 5 | -4 | |
| Green | Tim Retout | 253 | 5 | +0.0 | |
| Majority | |||||
| Turnout | 43.6 | ||||
| Liberal Democrats hold | Swing | ||||
| Liberal Democrats hold | Swing | ||||
Bromham and Biddenham
| Party | Candidate | Votes | % | ± | |
|---|---|---|---|---|---|
| Conservative | Roger Rigby* | 1,607 | 68.0 | -3.0 | |
| Conservative | Jon Gambold* | 1,565 | |||
| Liberal Democrats | Samuel Matthews | 450 | 19.0 | +7.7 | |
| Liberal Democrats | Stelios Mores | 386 | |||
| Labour | Gordon Charlton | 307 | 13.0 | -4.7 | |
| Labour | Ollie Charlton | 288 | |||
| Majority | |||||
| Turnout | 43.3 | ||||
| Conservative hold | Swing | ||||
| Conservative hold | Swing | ||||
Castle
| Party | Candidate | Votes | % | ± | |
|---|---|---|---|---|---|
| Green | Lucy Bywater | 957 | 43.3 | +27.3 | |
| Green | Ben Foley | 732 | |||
| Labour | Luigi Reale* | 690 | 31.3 | +6.0 | |
| Labour | Louise Whatham | 507 | |||
| Conservative | Karen Boyes | 416 | 18.8 | -10.2 | |
| Conservative | Robert Rigby | 340 | |||
| Liberal Democrats | Lorna Marchant | 145 | 6.6 | +1.2 | |
| Liberal Democrats | Pat Wood | 91 | |||
| Majority | 42 | ||||
| Turnout | 33.5 | -26.5 | |||
| Green gain from Conservative | Swing | ||||
| Green gain from Labour | Swing | ||||
Cauldwell
| Party | Candidate | Votes | % | ± | |
|---|---|---|---|---|---|
| Labour | Abu Sultan | 1,033 | 47.3 | -4.6 | |
| Labour | Fouzia Zamir | 970 | |||
| Conservative | Mohammed Islam | 527 | 24.1 | +4.4 | |
| Liberal Democrats | Jacob Bale | 342 | 15.6 | +9.2 | |
| Liberal Democrats | Joy Winder | 294 | |||
| Green | Kim Haskins | 284 | 13.0 | +6.3 | |
| Majority | |||||
| Turnout | 29.0 | ||||
| Labour hold | Swing | ||||
| Labour hold | Swing | ||||
Clapham
| Party | Candidate | Votes | % | ± | |
|---|---|---|---|---|---|
| Conservative | Jane Walker* | 723 | 63.6 | +14.1 | |
| Labour | Lynne Wady | 175 | 15.4 | -6.8 | |
| Renew | Eric Cooper | 161 | 14.2 | N/A | |
| Liberal Democrats | Stephen Rutherford | 77 | 6.8 | +2.1 | |
| Majority | |||||
| Turnout | 33.8 | ||||
| Conservative hold | Swing | ||||
De Parys
| Party | Candidate | Votes | % | ± | |
|---|---|---|---|---|---|
| Liberal Democrats | Henry Vann* | 1,178 | 61.0 | +28.8 | |
| Liberal Democrats | David Sawyer* | 1,125 | |||
| Conservative | Robin Illingworth | 510 | 26.4 | -3.0 | |
| Conservative | Andrea Spice | 456 | |||
| Labour | Conny Smith | 244 | 12.6 | -5.2 | |
| Labour | Laurence Turner | 209 | |||
| Majority | |||||
| Turnout | 40.4 | ||||
| Liberal Democrats hold | Swing | ||||
| Liberal Democrats hold | Swing | ||||
Eastcotts
| Party | Candidate | Votes | % | ± | |
|---|---|---|---|---|---|
| Liberal Democrats | Sarah-Jayne Gallagher* | 676 | 62.4 | +14.8 | |
| Conservative | Sam Ancliff | 215 | 19.9 | -12.1 | |
| Labour | Mansoor Nasir | 192 | 17.7 | -2.7 | |
| Majority | |||||
| Turnout | 1,083 | 31.7 | |||
| Liberal Democrats hold | Swing | ||||
Elstow and Stewartby
| Party | Candidate | Votes | % | ± | |
|---|---|---|---|---|---|
| Liberal Democrats | Tim Hill* | 1,062 | 79.5 | +32.9 | |
| Conservative | Jade Ancliff | 157 | 11.8 | -16.2 | |
| Labour | Anne Saunders | 117 | 8.8 | -8.8 | |
| Majority | |||||
| Turnout | 36.1 | ||||
| Liberal Democrats hold | Swing | ||||
Goldington
| Party | Candidate | Votes | % | ± | |
|---|---|---|---|---|---|
| Liberal Democrats | Tim Caswell | 882 | 38.4 | +15.2 | |
| Liberal Democrats | Christine McHugh | 871 | |||
| Labour | Anthony Forth* | 805 | 35.0 | +3.2 | |
| Labour | Jade Uko* | 726 | |||
| Conservative | Jenny Hedworth | 277 | 12.0 | -11.3 | |
| Conservative | Philip Merryman | 264 | |||
| UKIP | Adrian Haynes | 202 | 8.8 | -7.5 | |
| Green | Philippa Fleming | 133 | 5.8 | +0.4 | |
| Green | Jennifer Foley | 122 | |||
| Majority | |||||
| Turnout | 33.7 | ||||
| Liberal Democrats gain from Labour | Swing | ||||
| Liberal Democrats gain from Labour | Swing | ||||
Great Barford
| Party | Candidate | Votes | % | ± | |
|---|---|---|---|---|---|
| Conservative | Stephen Moon* | 1,392 | 54.1 | -9.2 | |
| Conservative | Phillippa Martin-Moran-Bryant | 1,090 | |||
| Liberal Democrats | Linda Carlton | 591 | 23.0 | +4.0 | |
| Liberal Democrats | Mark Fitzpatrick | 554 | |||
| Green | Tobias Waltham | 368 | 14.3 | -3.4 | |
| Labour | Pauline Webb | 222 | 8.6 | N/A | |
| Labour | Silas Wady | 178 | |||
| Majority | |||||
| Turnout | 38.9 | ||||
| Conservative hold | Swing | ||||
| Conservative hold | Swing | ||||
Harpur
| Party | Candidate | Votes | % | ± | |
|---|---|---|---|---|---|
| Labour | Colleen Atkins* | 1,217 | 54.5 | +4.7 | |
| Labour | Louise Jackson* | 1,022 | |||
| Independent | David Allen | 395 | 17.7 | +10.1 | |
| Liberal Democrats | Marion Zebedee-Topham | 337 | 15.1 | +8.9 | |
| Conservative | Jason Whaley | 285 | 12.8 | -8.7 | |
| Liberal Democrats | Alexandra Williams | 252 | |||
| Conservative | Phoebe Kirk-Fraiser | 250 | |||
| Majority | |||||
| Turnout | 34.4 | ||||
| Labour hold | Swing | ||||
| Labour hold | Swing | ||||
Harrold
| Party | Candidate | Votes | % | ± | |
|---|---|---|---|---|---|
| Conservative | Alison Foster* | 1,054 | 67.7 | -6.9 | |
| Green | Gary Lloyd | 311 | 20.0 | +4.0 | |
| Labour | John Dawson | 102 | 6.5 | N/A | |
| Liberal Democrats | Daniel Norton | 91 | 5.8 | -3.6 | |
| Majority | |||||
| Turnout | |||||
| Conservative hold | Swing | ||||
Kempston Central and East
| Party | Candidate | Votes | % | ± | |
|---|---|---|---|---|---|
| Labour | Kay Burley | 879 | 55.2 | +26.1 | |
| Labour | Mohammed Nawaz* | 807 | |||
| Conservative | Richard Hyde | 533 | 33.5 | -0.5 | |
| Conservative | Liam Rees | 399 | |||
| Liberal Democrats | Hannah Farthing | 180 | 11.3 | +4.4 | |
| Liberal Democrats | Sarika Shah | 125 | |||
| Majority | |||||
| Turnout | 31.2 | ||||
| Labour gain from Conservative | Swing | ||||
| Labour hold | Swing | ||||
Kempston North
| Party | Candidate | Votes | % | ± | |
|---|---|---|---|---|---|
| Labour | Sue Oliver* | 498 | 47.3 | +0.2 | |
| Conservative | Kathy Stone | 423 | 40.2 | -3.6 | |
| Green | Alison Parker | 83 | 7.9 | +1.4 | |
| Liberal Democrats | George Flaxman | 48 | 4.6 | +2.0 | |
| Majority | |||||
| Turnout | 36.1 | ||||
| Labour hold | Swing | ||||
Kempston Rural
| Party | Candidate | Votes | % | ± | |
|---|---|---|---|---|---|
| Conservative | Jim Weir | 860 | 42.7 | -27.4 | |
| Liberal Democrats | Steve Gallagher | 736 | 36.6 | +25.0 | |
| Labour | Ashley Frith | 251 | 12.5 | -5.8 | |
| Green | Ann Hagen | 166 | 8.2 | N/A | |
| Majority | |||||
| Turnout | 34.5 | ||||
| Conservative hold | Swing | ||||
Kempston South
| Party | Candidate | Votes | % | ± | |
|---|---|---|---|---|---|
| Labour | Carl Meader* | 1,000 | 83.5 | +14.2 | |
| Conservative | Barry Ryan | 157 | 13.1 | -12.6 | |
| Liberal Democrats | Conrad Longmore | 41 | 3.4 | +0.9 | |
| Majority | |||||
| Turnout | 37.4 | ||||
| Labour hold | Swing | ||||
Kempston West
| Party | Candidate | Votes | % | ± | |
|---|---|---|---|---|---|
| Labour | James Valentine | 631 | 52.1 | +9.5 | |
| Conservative | Matt McCarthy | 493 | 40.7 | +7.5 | |
| Liberal Democrats | Bipinchandra Shah | 87 | 7.2 | +2.8 | |
| Majority | |||||
| Turnout | 31.8 | ||||
| Labour hold | Swing | ||||
Kingsbrook
| Party | Candidate | Votes | % | ± | |
|---|---|---|---|---|---|
| Liberal Democrats | Patrick Solomon | 840 | 42.0 | ||
| Liberal Democrats | Dean Crofts | 830 | |||
| Labour | James Saunders* | 700 | 35.0 | ||
| Labour | Wendie Harvey | 583 | |||
| Conservative | Martine Moon | 256 | 12.8 | ||
| Green | Isabelle Sykes | 204 | 10.2 | ||
| Majority | |||||
| Turnout | 30.2 | ||||
| Liberal Democrats gain from Labour | Swing | ||||
| Liberal Democrats hold | Swing | ||||
Newnham
| Party | Candidate | Votes | % | ± | |
|---|---|---|---|---|---|
| Liberal Democrats | Hilde Hendrickx | 894 | 36.4 | ||
| Liberal Democrats | Jake Sampson | 795 | |||
| Conservative | John Mingay* | 751 | 30.6 | ||
| Conservative | Alison Crook | 687 | |||
| Labour | Shane Kelly | 421 | 17.2 | ||
| Labour | Ceciliah Chigwada | 414 | |||
| Green | Richard Baker | 387 | 15.8 | ||
| Green | Brant Tilds | 249 | |||
| Majority | |||||
| Turnout | 43.6 | ||||
| Liberal Democrats gain from Conservative | Swing | ||||
| Liberal Democrats gain from Conservative | Swing | ||||
Oakley
| Party | Candidate | Votes | % | ± | |
|---|---|---|---|---|---|
| Liberal Democrats | Jon Abbott | 887 | 57.7 | +54.1 | |
| Conservative | Andrew Senior | 575 | 37.4 | -2.0 | |
| Labour | Ian Bagueley | 76 | 4.9 | -1.7 | |
| Majority | |||||
| Turnout | 52.2 | ||||
| Liberal Democrats gain from Independent | Swing | ||||
Putnoe
| Party | Candidate | Votes | % | ± | |
|---|---|---|---|---|---|
| Liberal Democrats | Michael Headley* | 1,731 | 59.8 | +13.2 | |
| Liberal Democrats | Max Royden | 1,351 | |||
| Conservative | Dawn Allen | 724 | 25.0 | -8.5 | |
| Conservative | Mike Seamarks | 526 | |||
| Labour | Lila Begum | 238 | 8.2 | -5.4 | |
| Labour Co-op | Graham Tranquada | 216 | |||
| Green | Kate Retout | 203 | 7.0 | +0.6 | |
| Majority | |||||
| Turnout | 45.6 | ||||
| Liberal Democrats hold | Swing | ||||
| Liberal Democrats hold | Swing | ||||
Queens Park
| Party | Candidate | Votes | % | ± | |
|---|---|---|---|---|---|
| Labour | Nesreen Akhtar | 1,507 | 42.3 | -12.6 | |
| Labour | Mohammed Masud* | 1,291 | |||
| Independent | Taru Miah | 1,290 | 36.2 | N/A | |
| Conservative | Abdul Ahmed | 392 | 11.0 | -22.6 | |
| Green | Hannah Jones | 264 | 7.4 | -0.5 | |
| Conservative | June Kuria | 199 | |||
| Liberal Democrats | Michael Pattison | 108 | 3.0 | -0.7 | |
| Liberal Democrats | Janet Trengrove | 96 | |||
| Majority | |||||
| Turnout | 49.8 | ||||
| Labour hold | Swing | ||||
| Labour hold | Swing | ||||
Riseley
| Party | Candidate | Votes | % | ± | |
|---|---|---|---|---|---|
| Conservative | Martin Towler* | 823 | 60.5 | +2.5 | |
| Labour | Martyn Wady | 352 | 25.9 | +14.6 | |
| Liberal Democrats | Liam Martin-Day | 185 | 13.6 | +6.8 | |
| Majority | |||||
| Turnout | 50.1 | ||||
| Conservative hold | Swing | ||||
Sharnbrook
| Party | Candidate | Votes | % | ± | |
|---|---|---|---|---|---|
| Independent | Doug McMurdo* | 1,006 | 64.1 | +21.6 | |
| Conservative | Martin Quince | 403 | 25.7 | -10.5 | |
| Liberal Democrats | Bernadette Walsh-Mason | 91 | 5.8 | +1.8 | |
| Labour | Paul Barton | 69 | 4.4 | -6.5 | |
| Majority | |||||
| Turnout | 49.9 | ||||
| Independent hold | Swing | ||||
Wilshamstead
| Party | Candidate | Votes | % | ± | |
|---|---|---|---|---|---|
| Conservative | Graeme Coombes* | 992 | 73.8 | +1.0 | |
| Labour | Saqhib Ali | 212 | 15.8 | -0.6 | |
| Liberal Democrats | Malcolm Smith | 140 | 10.4 | -0.4 | |
| Majority | |||||
| Turnout | 34.8 | ||||
| Conservative hold | Swing | ||||
Wootton
| Party | Candidate | Votes | % | ± | |
|---|---|---|---|---|---|
| Conservative | John Wheeler* | 861 | 57.1 | +16.2 | |
| Liberal Democrats | Peter Stephens | 273 | 18.1 | -2.0 | |
| UKIP | Bill Hall | 192 | 12.7 | -8.8 | |
| Labour | Adrien Breadmore | 181 | 12.0 | +1.8 | |
| Majority | |||||
| Turnout | 32.4 | ||||
| Conservative hold | Swing | ||||
Wyboston
| Party | Candidate | Votes | % | ± | |
|---|---|---|---|---|---|
| Conservative | Tom Wootton* | 900 | 71.5 | -2.0 | |
| Liberal Democrats | Derek Eyre | 359 | 28.5 | +14.1 | |
| Majority | |||||
| Turnout | 42.1 | ||||
| Conservative hold | Swing | ||||
References
| Bedford Borough Council | |
|---|---|
| Central Bedfordshire Council | |
| Luton Borough Council | |
| Bedfordshire County Council |
|
| Mid Bedfordshire District Council | |
| South Bedfordshire District Council |
|
| |