2019 Derbyshire Dales District Council election
The Derbyshire Dales District Council election was held on 2 May 2019 to elect all 39 local councillors for Derbyshire Dales District Council.
| |||||||||||||||||||||||||||||||||||||||||||||||||||||||||||||
All 39 seats to Derbyshire Dales District Council 20 seats needed for a majority | |||||||||||||||||||||||||||||||||||||||||||||||||||||||||||||
|---|---|---|---|---|---|---|---|---|---|---|---|---|---|---|---|---|---|---|---|---|---|---|---|---|---|---|---|---|---|---|---|---|---|---|---|---|---|---|---|---|---|---|---|---|---|---|---|---|---|---|---|---|---|---|---|---|---|---|---|---|---|
| |||||||||||||||||||||||||||||||||||||||||||||||||||||||||||||
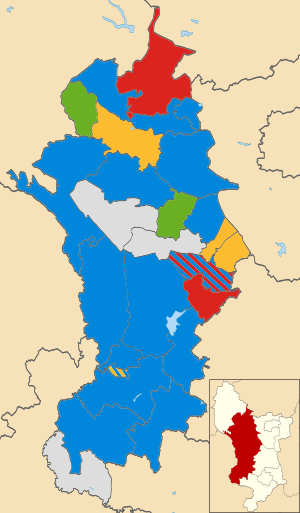 Map showing the composition of Derbyshire Dales District Council following the election. Striped wards have mixed representation. | |||||||||||||||||||||||||||||||||||||||||||||||||||||||||||||
| |||||||||||||||||||||||||||||||||||||||||||||||||||||||||||||
Ward Results
| Party | Candidate | Votes | % | ± | |
|---|---|---|---|---|---|
| Conservative | Sue Bull | 519 | 51.5 | ||
| Conservative | Stuart Lees | 515 | |||
| Liberal Democrats | Peter Dobbs | 325 | 29.3 | ||
| Liberal Democrats | Patricia Wildgoose | 263 | |||
| Labour | Andy White | 198 | 19.1 | ||
| Labour | Roslyn Hope | 187 | |||
| Majority | 190 | ||||
| Turnout | 2,007 | ||||
| Conservative hold | Swing | ||||
| Conservative hold | Swing | ||||
| Party | Candidate | Votes | % | ± | |
|---|---|---|---|---|---|
| Conservative | Tom Donnelly | 598 | 43.2 | ||
| Liberal Democrats | Robert Archer | 538 | 38.2 | ||
| Conservative | Dermot Murphy | 516 | |||
| Liberal Democrats | Robin Shirtcliffe | 447 | |||
| Labour | Peter Ginnis | 161 | 12.4 | ||
| Labour | Ruth Pugh | 160 | |||
| Green | John Hill | 157 | 6.1 | ||
| Majority | 22 | ||||
| Turnout | 2,577 | ||||
| Conservative hold | Swing | ||||
| Liberal Democrats gain from Conservative | Swing | ||||
| Party | Candidate | Votes | % | ± | |
|---|---|---|---|---|---|
| Conservative | Mark Wakeman | 1,025 | 77.3 | ||
| Conservative | Alyson Hill | 1,015 | |||
| Conservative | Alasdair Sutton | 939 | |||
| Labour | Paul Morgans | 465 | 22.7 | ||
| Labour | Helen Smith | 408 | |||
| Majority | 474 | ||||
| Turnout | 3,852 | ||||
| Conservative hold | Swing | ||||
| Conservative hold | Swing | ||||
| Conservative hold | Swing | ||||
| Party | Candidate | Votes | % | ± | |
|---|---|---|---|---|---|
| Conservative | Chris Furness | 324 | 57.4 | ||
| Labour | Les Swain | 240 | 42.6 | ||
| Majority | 84 | ||||
| Turnout | 564 | ||||
| Conservative hold | Swing | ||||
| Party | Candidate | Votes | % | ± | |
|---|---|---|---|---|---|
| Conservative | Michele Morley | 542 | 82.6 | ||
| Labour | Nicholas Bishop | 114 | 17.4 | ||
| Majority | 428 | ||||
| Turnout | 656 | ||||
| Conservative hold | Swing | ||||
| Party | Candidate | Votes | % | ± | |
|---|---|---|---|---|---|
| Conservative | Helen Froggatt | 329 | 48.5 | ||
| Green | Robert Scott | 219 | 32.2 | ||
| Labour | Thomas Barker | 131 | 19.3 | ||
| Majority | 110 | ||||
| Turnout | 679 | ||||
| Conservative hold | Swing | ||||
| Party | Candidate | Votes | % | ± | |
|---|---|---|---|---|---|
| Conservative | Lewis Rose | 374 | 59.6 | ||
| Liberal Democrats | Margaret Elsworth | 132 | 21.0 | ||
| Labour | Bob Allen | 122 | 19.4 | ||
| Majority | 155 | ||||
| Turnout | 628 | ||||
| Conservative hold | Swing | ||||
| Party | Candidate | Votes | % | ± | |
|---|---|---|---|---|---|
| Conservative | Susan Hobson | 456 | 74.0 | ||
| Liberal Democrats | Barbara Bowman | 100 | 16.2 | ||
| Labour | Jacob Butler | 60 | 9.7 | ||
| Majority | 356 | ||||
| Turnout | 616 | ||||
| Conservative hold | Swing | ||||
| Party | Candidate | Votes | % | ± | |
|---|---|---|---|---|---|
| Conservative | Andrew Shirley | 396 | 64.7 | ||
| Labour | Rob Pugh | 114 | 18.6 | ||
| UKIP | Richard Stone | 102 | 16.7 | ||
| Majority | 282 | ||||
| Turnout | 612 | ||||
| Conservative hold | Swing | ||||
| Party | Candidate | Votes | % | ± | |
|---|---|---|---|---|---|
| Conservative | Jason Atkin | 755 | 45.1 | ||
| Conservative | Mark Salt | 685 | |||
| Conservative | Andrew Statham | 653 | |||
| Liberal Democrats | Naomi Bell | 431 | 22.5 | ||
| Liberal Democrats | Andrew Creese | 374 | |||
| Green | Emma Hickling | 363 | 7.8 | ||
| Labour | Robert Golder | 324 | 18.8 | ||
| Labour | Lucy Peacock | 301 | |||
| UKIP | Paul Roe | 267 | 5.8 | ||
| Labour | Keith Kendrick | 246 | |||
| Liberal Democrats | Stephen Martin | 241 | |||
| Majority | 222 | ||||
| Turnout | 4,640 | ||||
| Conservative hold | Swing | ||||
| Conservative hold | Swing | ||||
| Conservative hold | Swing | ||||
| Party | Candidate | Votes | % | ± | |
|---|---|---|---|---|---|
| Conservative | Richard FitzHerbert | 424 | 73.7 | ||
| Liberal Democrats | Sandra Fearn | 78 | 13.6 | ||
| Labour | Sue Hodgson | 73 | 12.7 | ||
| Majority | 346 | ||||
| Turnout | 575 | ||||
| Conservative hold | Swing | ||||
| Party | Candidate | Votes | % | ± | |
|---|---|---|---|---|---|
| Independent | Jacqueline Allison | 343 | 53.8 | ||
| Conservative | Albert Catt | 238 | 37.3 | ||
| Labour | Laurie Butler | 57 | 8.9 | ||
| Majority | 105 | ||||
| Turnout | 638 | ||||
| Independent gain from Conservative | Swing | ||||
| Party | Candidate | Votes | % | ± | |
|---|---|---|---|---|---|
| Conservative | David Chapman | 289 | 59.8 | ||
| Green | John Youatt | 82 | 17.0 | ||
| Liberal Democrats | Asher Bond | 61 | 12.6 | ||
| Labour | John Cowings | 51 | 10.6 | ||
| Majority | 207 | ||||
| Turnout | 483 | ||||
| Conservative hold | Swing | ||||
| Party | Candidate | Votes | % | ± | |
|---|---|---|---|---|---|
| Labour | Peter O'Brien | 585 | 44.0 | ||
| Labour | Claire Raw | 552 | |||
| Conservative | Vicky Massey | 548 | 39.7 | ||
| Conservative | John Orchard | 479 | |||
| Liberal Democrats | Elanor Nancolas | 420 | 16.3 | ||
| Majority | 4 | ||||
| Turnout | 2,584 | ||||
| Labour gain from Conservative | Swing | ||||
| Labour gain from Conservative | Swing | ||||
| Party | Candidate | Votes | % | ± | |
|---|---|---|---|---|---|
| Conservative | Richard Bright | 445 | 80.2 | ||
| Labour | Rosie Ayliffe | 110 | 19.8 | ||
| Majority | 335 | ||||
| Turnout | 555 | ||||
| Conservative hold | Swing | ||||
| Party | Candidate | Votes | % | ± | |
|---|---|---|---|---|---|
| Independent | Graham Elliott | 460 | 86.0 | ||
| Labour | Richard Wingard | 75 | 14.0 | ||
| Majority | 385 | ||||
| Turnout | 535 | ||||
| Independent hold | Swing | ||||
| Party | Candidate | Votes | % | ± | |
|---|---|---|---|---|---|
| Liberal Democrats | Clare Gamble | 296 | 48.5 | ||
| Conservative | Geoff Stevens | 228 | 37.4 | ||
| Labour | Chris Cole | 86 | 14.1 | ||
| Majority | 68 | ||||
| Turnout | 610 | ||||
| Liberal Democrats gain from Conservative | Swing | ||||
| Party | Candidate | Votes | % | ± | |
|---|---|---|---|---|---|
| Labour | Joyce Pawley | 459 | 42.3 | ||
| Conservative | Garry Purdy | 386 | 34.6 | ||
| Labour | Andrew Hartley | 334 | |||
| Green | John Green | 273 | 14.6 | ||
| Conservative | Richard Walsh | 261 | |||
| UKIP | Bob Spowart | 156 | 8.3 | ||
| Majority | 52 | ||||
| Turnout | 1,869 | ||||
| Labour hold | Swing | ||||
| Conservative hold | Swing | ||||
| Party | Candidate | Votes | % | ± | |
|---|---|---|---|---|---|
| Liberal Democrats | Susan Burfoot | 1,465 | 71.1 | ||
| Liberal Democrats | Martin Burfoot | 1,322 | |||
| Liberal Democrats | Steve Wain | 1,182 | |||
| Conservative | Ann Elliott | 549 | 15.9 | ||
| Labour | Martin Rutter | 387 | 13.0 | ||
| Conservative | Elly Fawcett-Neal | 339 | |||
| Labour | Lucia Whitney | 339 | |||
| Majority | 633 | ||||
| Turnout | 5,583 | ||||
| Liberal Democrats hold | Swing | ||||
| Liberal Democrats hold | Swing | ||||
| Liberal Democrats gain from Conservative | Swing | ||||
| Party | Candidate | Votes | % | ± | |
|---|---|---|---|---|---|
| Liberal Democrats | Steve Flitter | 895 | 48.7 | ||
| Liberal Democrats | Paul Cruise | 746 | |||
| Liberal Democrats | David Hughes | 675 | |||
| Conservative | Jacquie Stevens | 520 | 29.6 | ||
| Conservative | Dan Hopkinson | 474 | |||
| Conservative | Alayne Green | 415 | |||
| Labour | Sylvia Needham | 359 | 21.6 | ||
| Labour | Peter Goulden | 352 | |||
| Labour | Phil Whitney | 318 | |||
| Majority | 155 | ||||
| Turnout | 4,754 | ||||
| Liberal Democrats hold | Swing | ||||
| Liberal Democrats gain from Labour | Swing | ||||
| Liberal Democrats gain from Conservative | Swing | ||||
| Party | Candidate | Votes | % | ± | |
|---|---|---|---|---|---|
| Conservative | Tony Morley | 435 | 82.9 | ||
| Labour | Jan Cole | 90 | 17.1 | ||
| Majority | 345 | ||||
| Turnout | 525 | ||||
| Conservative hold | Swing | ||||
| Party | Candidate | Votes | % | ± | |
|---|---|---|---|---|---|
| Green | Matthew Buckler | 200 | 39.9 | ||
| Conservative | Dave Oakley | 199 | 39.7 | ||
| Labour | Jennifer Joy-Matthews | 102 | 20.4 | ||
| Majority | 1 | ||||
| Turnout | 501 | ||||
| Green gain from Conservative | Swing | ||||
| Party | Candidate | Votes | % | ± | |
|---|---|---|---|---|---|
| Green | Neil Buttle | 204 | 42.1 | ||
| Conservative | Richard Hewson-Stoate | 167 | 34.5 | ||
| Labour | Chris Bowen | 113 | 23.3 | ||
| Majority | 37 | ||||
| Turnout | 484 | ||||
| Green gain from Conservative | Swing | ||||
| Party | Candidate | Votes | % | ± | |
|---|---|---|---|---|---|
| Independent | Colin Swindell | 758 | 97.2 | ||
| Labour | Charlie Phillips | 22 | 2.8 | ||
| Majority | 736 | ||||
| Turnout | 780 | ||||
| Independent hold | Swing | ||||
| Party | Candidate | Votes | % | ± | |
|---|---|---|---|---|---|
| Labour | Mike Ratcliffe | 1,200 | 65.4 | ||
| Labour | Pete Slack | 1,128 | |||
| Labour | Elisa McDonagh | 1,089 | |||
| Green | Ivan Dixon | 741 | 14.2 | ||
| Conservative | Gladwyn Gratton | 590 | 20.5 | ||
| Conservative | Angus Jenkins | 480 | |||
| Majority | 348 | ||||
| Turnout | 5,228 | ||||
| Labour hold | Swing | ||||
| Labour hold | Swing | ||||
| Labour hold | Swing | ||||
gollark: Have you tried remembering things instead of forgetting them?
gollark: We do have this technology.
gollark: They're a great technology.
gollark: Incorrect. We've been through this.
gollark: <@160279332454006795>
References
- "District council elections". Derbyshire Dales District Council. Retrieved 2019-05-03.
This article is issued from Wikipedia. The text is licensed under Creative Commons - Attribution - Sharealike. Additional terms may apply for the media files.