1979 Basildon District Council election
The 1979 Basildon District Council election took place on 3 May 1979 to elect members of Basildon District Council in Essex, England. This was on the same day as other local elections. It was the first election to be held new ward boundaries. The council remained under no overall control.
| |||||||||||||||||||||||||||||
All 42 seats to Basildon District Council 22 seats needed for a majority | |||||||||||||||||||||||||||||
|---|---|---|---|---|---|---|---|---|---|---|---|---|---|---|---|---|---|---|---|---|---|---|---|---|---|---|---|---|---|
| |||||||||||||||||||||||||||||
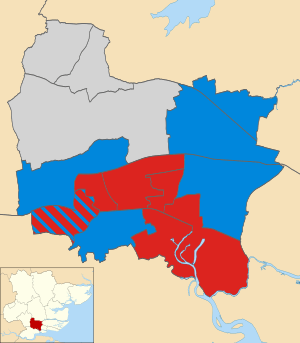 Map showing the results of contested wards in the 1979 Basildon Borough Council elections. | |||||||||||||||||||||||||||||
| |||||||||||||||||||||||||||||
Overall results
| Party | Seats | Gains | Losses | Net gain/loss | Seats % | Votes % | Votes | +/− | |
|---|---|---|---|---|---|---|---|---|---|
| Labour | 17 | 40.5 | 35.4 | 28,779 | |||||
| Conservative | 16 | 38.1 | 41.2 | 33,494 | |||||
| Residents | 9 | 22.5 | 11.9 | 9,700 | |||||
| Liberal | 0 | 0.0 | 11.4 | 9,248 | |||||
| Total | 42 | 81,221 | |||||||
Ward results
Billericay East (3 seats)
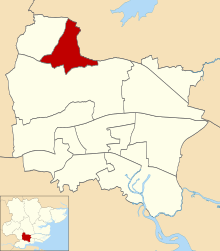
Location of Billericay East ward
| Party | Candidate | Votes | % | ||
|---|---|---|---|---|---|
| Residents | R. Harness | 3,099 | |||
| Residents | S. Wallis | 3,064 | |||
| Residents | M. White | 3,023 | |||
| Conservative | A. Archer | 2,733 | |||
| Conservative | R. Marshall | 2,671 | |||
| Conservative | E. Guy | 2,669 | |||
| Labour | I. Moul | 787 | |||
| Labour | C. Caine | 753 | |||
| Labour | G. Brooke | 713 | |||
| Turnout | 85.1% | ||||
| Residents win (new seat) | |||||
| Residents win (new seat) | |||||
| Residents win (new seat) | |||||
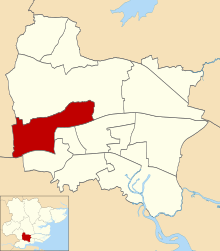
Billericay West (3 seats)
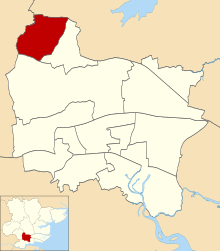
Location of Billericay West ward
| Party | Candidate | Votes | % | ||
|---|---|---|---|---|---|
| Residents | A. Greaves | 3,277 | |||
| Residents | A. Evans | 3,265 | |||
| Residents | H. Wilkins | 3,154 | |||
| Conservative | G. Copley | 1,878 | |||
| Conservative | D. Almond | 1,865 | |||
| Conservative | W. Lea | 1,693 | |||
| Labour | E. Greenhow | 270 | |||
| Labour | S. Townsend | 258 | |||
| Labour | R. Waters | 215 | |||
| Turnout | 85.4% | ||||
| Residents win (new seat) | |||||
| Residents win (new seat) | |||||
| Residents win (new seat) | |||||
Burstead (3 seats)
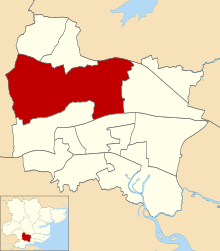
Location of Burstead ward
| Party | Candidate | Votes | % | ||
|---|---|---|---|---|---|
| Residents | C. Jones | 3,324 | |||
| Residents | B. Hooks | 3,220 | |||
| Residents | J. Kemp | 3,048 | |||
| Conservative | F. Janaway | 2,480 | |||
| Conservative | M. Marshall | 2,466 | |||
| Conservative | J. Wright | 2,402 | |||
| Labour | A. Edge | 646 | |||
| Labour | L. Edge | 637 | |||
| Labour | R. Pattle | 628 | |||
| Turnout | 82.6% | ||||
| Residents win (new seat) | |||||
| Residents win (new seat) | |||||
| Residents win (new seat) | |||||
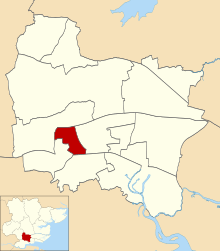
Fryerns Central (3 seats)
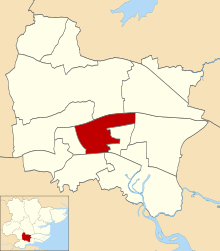
Location of Fryerns Central ward
| Party | Candidate | Votes | % | ||
|---|---|---|---|---|---|
| Labour | P. Ballard | 3,800 | |||
| Labour | R. Walker | 3,656 | |||
| Labour | C. O'Brien | 3,617 | |||
| Conservative | R. Sheridan | 2,239 | |||
| Conservative | E. Cullis | 2,201 | |||
| Conservative | E. Roy | 2,081 | |||
| Liberal | H. Lutton | 892 | |||
| Turnout | 75.3% | ||||
| Labour win (new seat) | |||||
| Labour win (new seat) | |||||
| Labour win (new seat) | |||||
Fryerns East (3 seats)
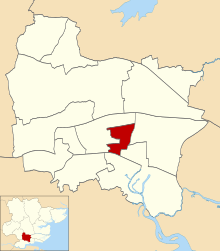
Location of Fryerns East ward
| Party | Candidate | Votes | % | ||
|---|---|---|---|---|---|
| Labour | A. Dove | 3,457 | |||
| Labour | J. Potter | 2,958 | |||
| Labour | D. Harrison | 2,842 | |||
| Conservative | D. Barker | 2,184 | |||
| Conservative | M. Manouvrier | 2,080 | |||
| Conservative | R. Pennell | 1,967 | |||
| Liberal | D. Mavis | 776 | |||
| Turnout | 74.7% | ||||
| Labour win (new seat) | |||||
| Labour win (new seat) | |||||
| Labour win (new seat) | |||||
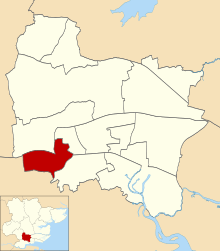
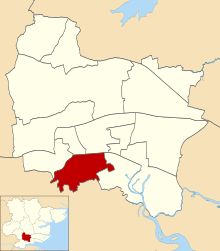
Laindon (3 seats)
Location of Laindon ward
| Party | Candidate | Votes | % | ||
|---|---|---|---|---|---|
| Conservative | G. Doyle | 1,707 | |||
| Conservative | D. Lovey | 1,543 | |||
| Conservative | V. York | 1,508 | |||
| Labour | K. Godley | 1,145 | |||
| Labour | I. Harlow | 1,072 | |||
| Labour | T. Wilson | 1,043 | |||
| Liberal | J. Massie | 356 | |||
| Turnout | 74.8% | ||||
| Conservative win (new seat) | |||||
| Conservative win (new seat) | |||||
| Conservative win (new seat) | |||||
Langdon Hills (3 seats)
Location of Langdon Hills ward
| Party | Candidate | Votes | % | ||
|---|---|---|---|---|---|
| Labour | C. Lynch | 2,110 | |||
| Conservative | J. Hunter | 2,039 | |||
| Labour | J. Bielby | 1,982 | |||
| Conservative | R. Read | 1,960 | |||
| Conservative | M. Davies | 1,941 | |||
| Labour | M. Lynch | 1,888 | |||
| Liberal | I. Campion-Smith | 621 | |||
| Turnout | 70.8% | ||||
| Labour win (new seat) | |||||
| Conservative win (new seat) | |||||
| Labour win (new seat) | |||||
Lee Chapel North (3 seats)
Location of Lee Chapel North ward
| Party | Candidate | Votes | % | ||
|---|---|---|---|---|---|
| Labour | J. Costello | 3,634 | |||
| Labour | R. Austin | 3,208 | |||
| Labour | D. Austin | 3,139 | |||
| Conservative | R. Wallis | 1,892 | |||
| Conservative | G. Dobbs | 1,845 | |||
| Conservative | W. West | 1,710 | |||
| Liberal | M. Howard | 764 | |||
| Turnout | 79.2% | ||||
| Labour win (new seat) | |||||
| Labour win (new seat) | |||||
| Labour win (new seat) | |||||
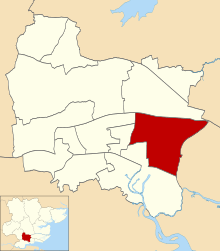
Nethermayne (3 seats)
Location of Nethermayne ward
| Party | Candidate | Votes | % | ||
|---|---|---|---|---|---|
| Conservative | S. Blackbourn | 2,974 | |||
| Conservative | P. Cole | 2,752 | |||
| Conservative | H. Tucker | 2,633 | |||
| Labour | P. Davey | 2,595 | |||
| Labour | A. Borlase | 2,475 | |||
| Labour | G. Krejzl | 2,318 | |||
| Liberal | B. Holmes | 834 | |||
| Turnout | 78.4% | ||||
| Conservative win (new seat) | |||||
| Conservative win (new seat) | |||||
| Conservative win (new seat) | |||||
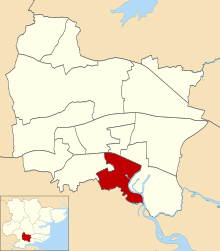
Pitsea East (3 seats)
Location of Pitsea East ward
| Party | Candidate | Votes | % | ||
|---|---|---|---|---|---|
| Conservative | E. Dines | 1,780 | |||
| Conservative | K. Emery | 1,760 | |||
| Conservative | F. Laine | 1,655 | |||
| Labour | W. Blunkell | 1,427 | |||
| Labour | R. Oliver | 1,369 | |||
| Labour | D. Marks | 1,275 | |||
| Liberal | S. Holmes | 492 | |||
| Turnout | 72.0% | ||||
| Conservative win (new seat) | |||||
| Conservative win (new seat) | |||||
| Conservative win (new seat) | |||||
Pitsea West (3 seats)
Location of Pitsea West ward
| Party | Candidate | Votes | % | ||
|---|---|---|---|---|---|
| Labour | J. Amey | 2,942 | |||
| Labour | H. Tinworth | 2,577 | |||
| Labour | E. Gelder | 2,567 | |||
| Conservative | A. Dines | 2,229 | |||
| Conservative | D. McCree | 2,106 | |||
| Conservative | A. McIntyre | 2,005 | |||
| Liberal | B. Mavis | 1,195 | |||
| Turnout | 72.5% | ||||
| Labour win (new seat) | |||||
| Labour win (new seat) | |||||
| Labour win (new seat) | |||||
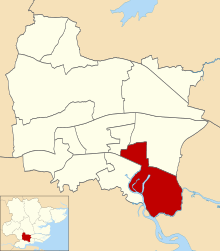
Vange (3 seats)
Location of Vange ward
| Party | Candidate | Votes | % | ||
|---|---|---|---|---|---|
| Labour | G. Miller | 2,692 | |||
| Labour | H. Miller | 2,576 | |||
| Labour | H. Witzer | 2,334 | |||
| Conservative | J. Dolby | 1,902 | |||
| Conservative | J. Ross | 1,873 | |||
| Conservative | A. Oram | 1,857 | |||
| Liberal | S. Massie | 739 | |||
| Turnout | 73.7% | ||||
| Labour win (new seat) | |||||
| Labour win (new seat) | |||||
| Labour win (new seat) | |||||
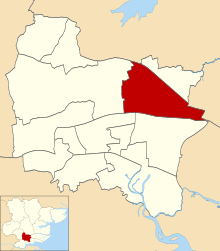
Wickford North (3 seats)
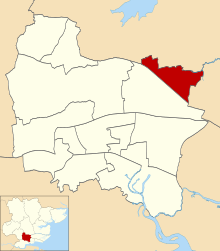
Location of Wickford North ward
| Party | Candidate | Votes | % | ||
|---|---|---|---|---|---|
| Conservative | V. Ridley | 3,615 | |||
| Conservative | B. Pummell | 3,435 | |||
| Conservative | L. Yorke | 3,286 | |||
| Labour | R. Turpin | 1,782 | |||
| Labour | J. Selby | 1,737 | |||
| Labour | M. Walsh | 1,662 | |||
| Liberal | M. Samson | 1,460 | |||
| Turnout | 73.7% | ||||
| Conservative win (new seat) | |||||
| Conservative win (new seat) | |||||
| Conservative win (new seat) | |||||
Wickford South (3 seats)
Location of Wickford South ward
| Party | Candidate | Votes | % | ||
|---|---|---|---|---|---|
| Conservative | C. Ball | 3,842 | |||
| Conservative | T. Taylor | 3,529 | |||
| Conservative | G. Jones | 3,276 | |||
| Labour | A. Coupe | 1,492 | |||
| Labour | L. Borlase | 1,267 | |||
| Labour | A. McCartan | 1,119 | |||
| Liberal | T. Kabir | 1,008 | |||
| Turnout | 82.9% | ||||
| Conservative win (new seat) | |||||
| Conservative win (new seat) | |||||
| Conservative win (new seat) | |||||
gollark: Just... train a neural network... to... compile BF to assembly?
gollark: Procedurally generate one.
gollark: Advantages of the browser version I guess.
gollark: I've got three Discord tabs open now because it handles scrolling/message history so badly.
gollark: Sad!
References
- "Council compositions by year". The Elections Centre.
- "Local Election Summaries 1979". The Elections Centre.
- "Basildon District Council Election Results 1973–2012" (PDF). Elections Centre. Retrieved 3 August 2019.
| Metropolitan boroughs |
|
|---|---|
| District councils (England) |
|
| District councils (Wales) |
|
| Referendums | |
This article is issued from Wikipedia. The text is licensed under Creative Commons - Attribution - Sharealike. Additional terms may apply for the media files.