2000 Derby City Council election
The 2000 Derby City Council election took place on 4 May 2000 to elect members of Derby City Council in England. One third of the council was up for election and the Labour party kept overall control of the council.[3]
| |||||||||||||||||||||||||||||
15 of the 44 seats in the Derby City Council 23 seats needed for a majority | |||||||||||||||||||||||||||||
|---|---|---|---|---|---|---|---|---|---|---|---|---|---|---|---|---|---|---|---|---|---|---|---|---|---|---|---|---|---|
| |||||||||||||||||||||||||||||
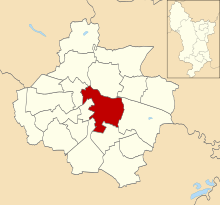
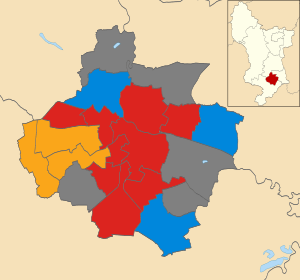 Map showing the results of the 2000 Derby City Council elections. | |||||||||||||||||||||||||||||
| |||||||||||||||||||||||||||||
After the election, the composition of the council was
Election result
| Party | Seats | Gains | Losses | Net gain/loss | Seats % | Votes % | Votes | +/− | |
|---|---|---|---|---|---|---|---|---|---|
| Labour | 9 | 0 | 5 | 60.0 | 42.5 | 14,205 | |||
| Conservative | 3 | 3 | 0 | 20.0 | 35.2 | 11,761 | |||
| Liberal Democrats | 3 | 2 | 0 | 20.0 | 22.3 | 7,443 | |||
Ward results
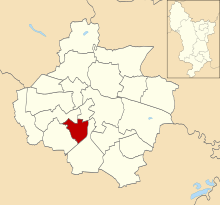
Abbey
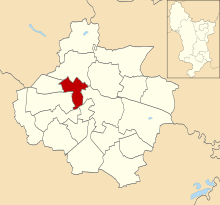
Location of Abbey ward
| Party | Candidate | Votes | % | |
|---|---|---|---|---|
| Labour | M. Fuller | 906 | 54.4% | |
| Conservative | H. Love | 422 | 25.3% | |
| Liberal Democrats | P. Clayden | 338 | 20.3% | |
| Turnout | 14.8% | |||
| Labour hold | ||||
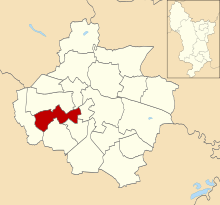
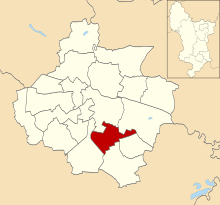
Babington
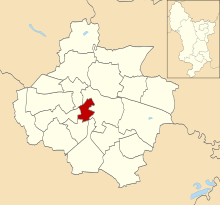
Location of Babington ward
| Party | Candidate | Votes | % | |
|---|---|---|---|---|
| Labour | A. Hussain | 1,235 | 64.3% | |
| Conservative | J. Iqbal | 491 | 25.6% | |
| Liberal Democrats | D. Mensah | 194 | 10.1% | |
| Turnout | 26.8% | |||
| Labour hold | ||||
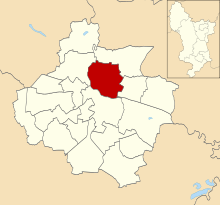
Chaddesden
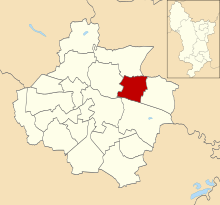
Location of Chaddesden ward
| Party | Candidate | Votes | % | |
|---|---|---|---|---|
| Labour | S. Bolton | 1,107 | 50.1% | |
| Conservative | J. Veitch | 891 | 40.4% | |
| Liberal Democrats | B. Harry | 210 | 9.5% | |
| Turnout | 27.5% | |||
| Labour hold | ||||
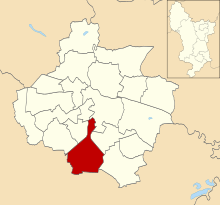
Chellaston
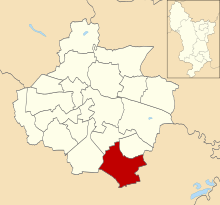
Location of Chellaston ward
| Party | Candidate | Votes | % | |
|---|---|---|---|---|
| Conservative | D. Black | 1,635 | 49.9% | |
| Labour | D. Whitehead | 1,396 | 42.6% | |
| Liberal Democrats | E. Ashburner | 244 | 7.5% | |
| Turnout | 32.2% | |||
| Conservative gain from Labour | ||||
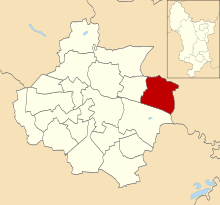
Darley
Location of Darley ward
| Party | Candidate | Votes | % | |
|---|---|---|---|---|
| Conservative | J. Leatherbarrow | 1,796 | 51.0% | |
| Labour | E. Wooley | 1,316 | 37.4% | |
| Liberal Democrats | S. King | 410 | 11.6% | |
| Turnout | 37.7% | |||
| Conservative gain from Labour | ||||
Derwent
Location of Derwent ward
| Party | Candidate | Votes | % | |
|---|---|---|---|---|
| Labour | D. Roberts | 771 | 59.6% | |
| Conservative | P. West | 365 | 28.2% | |
| Liberal Democrats | J-P. Keane | 157 | 12.1% | |
| Turnout | 17.6% | |||
| Labour hold | ||||
Kingsway
Location of Kingsway ward
| Party | Candidate | Votes | % | |
|---|---|---|---|---|
| Liberal Democrats | A. Hanson | 1,439 | 50.6% | |
| Conservative | B. Maw | 776 | 27.3% | |
| Labour | A. Graves | 628 | 22.1% | |
| Turnout | 36.4% | |||
| Liberal Democrats gain from Labour | ||||
Litchurch
Location of Litchurch ward
| Party | Candidate | Votes | % | |
|---|---|---|---|---|
| Labour | M. Akhtar | 877 | 66.2% | |
| Conservative | J. Magee | 323 | 24.4% | |
| Liberal Democrats | A. Savage | 125 | 9.4% | |
| Turnout | 18.5% | |||
| Labour hold | ||||
Littleover
Location of Littleover ward
| Party | Candidate | Votes | % | |
|---|---|---|---|---|
| Liberal Democrats | L. Care | 1,736 | 62.0% | |
| Conservative | C. Charlesworth | 559 | 20.0% | |
| Labour | H. Malcolm-Walker | 504 | 18.0% | |
| Turnout | 39.0% | |||
| Liberal Democrats hold | ||||
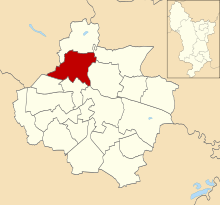
Mackworth
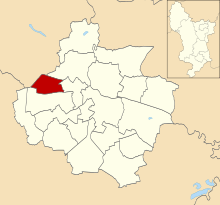
Location of Mackworth ward
| Party | Candidate | Votes | % | |
|---|---|---|---|---|
| Labour | R. Baxter | 853 | 55.0% | |
| Conservative | S. Hart | 542 | 34.9% | |
| Liberal Democrats | A. Dark | 157 | 10.1% | |
| Turnout | 24.9% | |||
| Labour hold | ||||
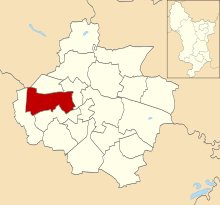
Mickleover
Location of Mickleover ward
| Party | Candidate | Votes | % | |
|---|---|---|---|---|
| Liberal Democrats | H. Jones | 1,544 | 43.2% | |
| Conservative | R. Wood | 1,239 | 34.7% | |
| Labour | P. Taylor | 788 | 22.1% | |
| Turnout | 38.3% | |||
| Liberal Democrats gain from Labour | ||||
Normanton
Location of Normanton ward
| Party | Candidate | Votes | % | |
|---|---|---|---|---|
| Labour | R. Jones | 835 | 55.8% | |
| Conservative | J. Lee | 396 | 26.5% | |
| Liberal Democrats | B. Lowe | 266 | 17.8% | |
| Turnout | 21.7% | |||
| Labour hold | ||||
Osmanton
Location of Osmaston ward
| Party | Candidate | Votes | % | |
|---|---|---|---|---|
| Labour | R. Turner | 514 | 58.8% | |
| Conservative | A. Javed | 195 | 22.3% | |
| Liberal Democrats | L. Alcock | 165 | 18.9% | |
| Turnout | % | |||
| Labour hold | ||||
Sinfin
Location of Sinfin ward
| Party | Candidate | Votes | % | |
|---|---|---|---|---|
| Labour | A. Mullarkey | 1,132 | 70.0% | |
| Conservative | T. Hart | 328 | 20.3% | |
| Liberal Democrats | M. Skelton | 156 | 9.7% | |
| Turnout | 20.2% | |||
| Labour hold | ||||
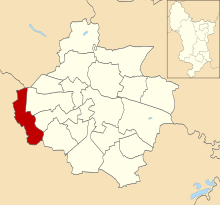
Spondon
Location of Spondon ward
| Party | Candidate | Votes | % | |
|---|---|---|---|---|
| Conservative | E. Berry | 1,803 | 52.3% | |
| Labour | M. Byrne | 1,343 | 39.0% | |
| Liberal Democrats | P. Peat | 302 | 8.8% | |
| Turnout | 35.7% | |||
| Conservative gain from Labour | ||||
gollark: * 95%
gollark: Oh, 94% of smart TVs run GTech™ GRootkit™.
gollark: Yes. They may not have rsync.
gollark: * for correctly configured Linux machines
gollark: With mDNS, rsync and bee apioids, file transfer over LAN is trivial*!
References
- "Council compositions by year". The Elections Centre.
- "Local Election Summaries 2000". The Elections Centre.
- "Derby". BBC News Online. Retrieved 27 September 2009.
- "Election results: local councils". The Times. 5 May 2000. p. 4.
- "Local council results". Financial Times. 6 May 2000. p. 6.
- "Derby City Council Election Results 1979-1995" (PDF). Elections Centre.
This article is issued from Wikipedia. The text is licensed under Creative Commons - Attribution - Sharealike. Additional terms may apply for the media files.