2000 Wirral Metropolitan Borough Council election
The 2000 Wirral Metropolitan Borough Council election took place on 4 May 2000 to elect members of Wirral Metropolitan Borough Council in England.[2] This election was held on the same day as other local elections.
| |||||||||||||||||||||||||||||||||||||||||||||||||
22 of 66 seats (One Third) to Wirral Metropolitan Borough Council 34 seats needed for a majority | |||||||||||||||||||||||||||||||||||||||||||||||||
|---|---|---|---|---|---|---|---|---|---|---|---|---|---|---|---|---|---|---|---|---|---|---|---|---|---|---|---|---|---|---|---|---|---|---|---|---|---|---|---|---|---|---|---|---|---|---|---|---|---|
| Turnout | 27.1% ( | ||||||||||||||||||||||||||||||||||||||||||||||||
| |||||||||||||||||||||||||||||||||||||||||||||||||
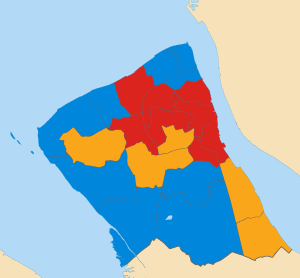
 Map of results of 2000 election | |||||||||||||||||||||||||||||||||||||||||||||||||
| |||||||||||||||||||||||||||||||||||||||||||||||||
After the election, the composition of the council was:
| Party | Seats | ± | |
|---|---|---|---|
| Labour | 34 | ||
| Conservative | 20 | ||
| Liberal Democrats | 12 | ||
Election results
Overall election result
Overall result compared with 1999.
| Wirral Metropolitan Borough Council election results, 2000 | |||||||||||||||
|---|---|---|---|---|---|---|---|---|---|---|---|---|---|---|---|
| Party | Candidates | Votes | |||||||||||||
| Stood | Elected | Gained | Unseated | Net | % of total | % | No. | Net % | |||||||
| Conservative | 22 | 5 | 4 | 1 | 40.9 | 40.7 | 27,238 | ||||||||
| Labour | 22 | 8 | 0 | 5 | 36.4 | 30.7 | 20,542 | ||||||||
| Liberal Democrats | 22 | 5 | 2 | 0 | 22.7 | 25.8 | 17,271 | ||||||||
| Green | 19 | 0 | 0 | 0 | 0.0 | 2.8 | 1,846 | ||||||||
Ward results
Bebington
| Party | Candidate | Votes | % | ± | |
|---|---|---|---|---|---|
| Conservative | Jacqueline Hall | 1,712 | 45.7 | ||
| Labour | Keith Williams | 1,550 | 41.4 | ||
| Liberal Democrats | Nigel Dyer | 374 | 10.0 | ||
| Green | Ann Jones | 108 | 2.9 | ||
| Majority | 162 | 4.3 | N/A | ||
| Registered electors | 10,923 | ||||
| Turnout | 34.3 | ||||
| Conservative gain from Labour | Swing | ||||
Bidston
| Party | Candidate | Votes | % | ± | |
|---|---|---|---|---|---|
| Labour | James Crabtree | 788 | 73.3 | ||
| Conservative | Yvonne Sanne | 142 | 13.2 | ||
| Liberal Democrats | John Tomlinson | 113 | 10.5 | ||
| Green | Pamela Holstein | 32 | 3.0 | ||
| Majority | 646 | 60.1 | |||
| Registered electors | 7,790 | ||||
| Turnout | 13.8 | ||||
| Labour hold | Swing | ||||
Birkenhead
| Party | Candidate | Votes | % | ± | |
|---|---|---|---|---|---|
| Labour | Jean Stapleton | 1,107 | 71.3 | ||
| Conservative | Barbara Poole | 184 | 11.8 | ||
| Liberal Democrats | Mary Williams | 171 | 11.0 | ||
| Green | Stuart Harvey | 91 | 5.9 | ||
| Majority | 923 | 59.4 | |||
| Registered electors | 10,099 | ||||
| Turnout | 15.4 | ||||
| Labour hold | Swing | ||||
Bromborough
| Party | Candidate | Votes | % | ± | |
|---|---|---|---|---|---|
| Liberal Democrats | Robert Moon | 1,390 | 46.0 | ||
| Labour | Robert Buckingham | 1,080 | 35.7 | ||
| Conservative | Ian Mackenzie | 475 | 15.7 | ||
| Green | Patricia Farmer | 78 | 2.6 | ||
| Majority | 310 | 10.3 | N/A | ||
| Registered electors | 10,852 | ||||
| Turnout | 27.9 | ||||
| Liberal Democrats gain from Labour | Swing | ||||
Clatterbridge
| Party | Candidate | Votes | % | ± | |
|---|---|---|---|---|---|
| Conservative | Michael Moore | 2,126 | 41.8 | ||
| Liberal Democrats | Alan Taylor | 1,880 | 37.0 | ||
| Labour | Audrey Moore | 974 | 19.2 | ||
| Green | Michael Harper | 106 | 2.1 | ||
| Majority | 246 | 4.8 | N/A | ||
| Registered electors | 14,044 | ||||
| Turnout | 36.2 | ||||
| Conservative hold | Swing | ||||
Claughton
| Party | Candidate | Votes | % | ± | |
|---|---|---|---|---|---|
| Labour | George Davies | 1,324 | 53.9 | ||
| Conservative | Patricia Jones | 627 | 25.5 | ||
| Liberal Democrats | Stephen Blaycock | 406 | 16.5 | ||
| Green | Elisabeth Heydon | 99 | 4.0 | ||
| Majority | 697 | 28.4 | |||
| Registered electors | 11,050 | ||||
| Turnout | 22.3 | ||||
| Labour hold | Swing | ||||
Eastham
| Party | Candidate | Votes | % | ± | |
|---|---|---|---|---|---|
| Liberal Democrats | Phillip Gilchrist | 2,469 | 67.9 | ||
| Conservative | Barbara Green | 582 | 16.0 | ||
| Labour | Colin Kirwan | 542 | 14.9 | ||
| Green | Brian Gibbs | 41 | 1.1 | ||
| Majority | 1,887 | 51.9 | |||
| Registered electors | 11,264 | ||||
| Turnout | 32.3 | ||||
| Liberal Democrats hold | Swing | ||||
Egerton
| Party | Candidate | Votes | % | ± | |
|---|---|---|---|---|---|
| Labour | Andrew Dow | 1,063 | 55.0 | ||
| Conservative | Cyrus Ferguson | 455 | 23.6 | ||
| Liberal Democrats | Philip Lloyd | 283 | 14.6 | ||
| Green | Catherine Page | 131 | 6.8 | ||
| Majority | 608 | 31.5 | |||
| Registered electors | 10,643 | ||||
| Turnout | 18.2 | ||||
| Labour hold | Swing | ||||
Heswall
| Party | Candidate | Votes | % | ± | |
|---|---|---|---|---|---|
| Conservative | Stephen Rowlands | 2,985 | 71.8 | ||
| Labour | Albert McCabe | 576 | 13.9 | ||
| Liberal Democrats | Edward Norton | 467 | 11.2 | ||
| Green | Garnette Bowler | 128 | 3.1 | ||
| Majority | 2,409 | 58.0 | |||
| Registered electors | 13,478 | ||||
| Turnout | 30.9 | ||||
| Conservative hold | Swing | ||||
Hoylake
| Party | Candidate | Votes | % | ± | |
|---|---|---|---|---|---|
| Conservative | Hilary Jones | 2,680 | 68.4 | ||
| Labour | Alan Milne | 570 | 14.5 | ||
| Liberal Democrats | Alan Richards | 470 | 12.0 | ||
| Green | Allen Burton | 199 | 5.1 | ||
| Majority | 2,110 | 53.8 | |||
| Registered electors | 12,605 | ||||
| Turnout | 31.1 | ||||
| Conservative hold | Swing | ||||
Leasowe
| Party | Candidate | Votes | % | ± | |
|---|---|---|---|---|---|
| Labour | Ronald Abbey | 936 | 56.6 | ||
| Conservative | Simon Mountney | 436 | 26.4 | ||
| Liberal Democrats | Raymond Hayden | 281 | 17.0 | ||
| Majority | 500 | 30.2 | |||
| Registered electors | 9,390 | ||||
| Turnout | 17.6 | ||||
| Labour hold | Swing | ||||
Liscard
| Party | Candidate | Votes | % | ± | |
|---|---|---|---|---|---|
| Conservative | Alan Robinson | 1,185 | 45.8 | ||
| Labour | Denis Knowles | 1,005 | 38.8 | ||
| Liberal Democrats | Richard Ellett | 297 | 11.5 | ||
| Green | Matthew Adams | 101 | 3.9 | New | |
| Majority | 180 | 7.0 | N/A | ||
| Registered electors | 11,135 | ||||
| Turnout | 23.3 | ||||
| Conservative gain from Labour | Swing | ||||
Moreton
| Party | Candidate | Votes | % | ± | |
|---|---|---|---|---|---|
| Conservative | Christopher Blakeley | 1,613 | 55.9 | ||
| Labour | Ann McLachlan | 1,023 | 35.4 | ||
| Liberal Democrats | Susanne Uriel | 251 | 8.7 | ||
| Majority | 590 | 20.4 | N/A | ||
| Registered electors | 9,947 | ||||
| Turnout | 29.1 | ||||
| Conservative gain from Labour | Swing | ||||
New Brighton
| Party | Candidate | Votes | % | ± | |
|---|---|---|---|---|---|
| Conservative | Anthony Pritchard | 1,503 | 51.4 | ||
| Labour | John Salter | 1,049 | 35.9 | ||
| Liberal Democrats | John Codling | 264 | 9.0 | ||
| Green | George Bowler | 108 | 3.7 | ||
| Majority | 454 | 15.5 | N/A | ||
| Registered electors | 11,579 | ||||
| Turnout | 25.3 | ||||
| Conservative gain from Labour | Swing | ||||
Oxton
| Party | Candidate | Votes | % | ± | |
|---|---|---|---|---|---|
| Liberal Democrats | Freda Anderson | 1,683 | 56.8 | ||
| Conservative | Leonard Moore | 620 | 20.9 | ||
| Labour | John Mitchell | 540 | 18.2 | ||
| Green | Pamela Mitchell | 122 | 4.1 | ||
| Majority | 1,063 | 35.9 | |||
| Registered electors | 11,544 | ||||
| Turnout | 25.7 | ||||
| Liberal Democrats hold | Swing | ||||
Prenton
| Party | Candidate | Votes | % | ± | |
|---|---|---|---|---|---|
| Liberal Democrats | Margaret Bridson | 1,924 | 55.5 | ||
| Conservative | Ian McKellar | 843 | 24.3 | ||
| Labour | June Williams | 633 | 18.3 | ||
| Green | John Wilson | 68 | 2.0 | ||
| Majority | 1,081 | 31.2 | |||
| Registered electors | 11,659 | ||||
| Turnout | 29.8 | ||||
| Liberal Democrats hold | Swing | ||||
Royden
| Party | Candidate | Votes | % | ± | |
|---|---|---|---|---|---|
| Liberal Democrats | Peter Reisdorf | 2,507 | 48.1 | ||
| Conservative | Derek Robinson | 2,203 | 42.3 | ||
| Labour | William Ward | 420 | 8.1 | ||
| Green | Barbara Burton | 77 | 1.5 | ||
| Majority | 304 | 5.8 | N/A | ||
| Registered electors | 12,914 | ||||
| Turnout | 40.3 | ||||
| Liberal Democrats gain from Conservative | Swing | ||||
Seacombe
Incumbent councillor for Bromborough and leader of the council Dave Jackson died in April 2000, days before he was due to stand, causing the election to be delayed.[20]
| Party | Candidate | Votes | % | ± | |
|---|---|---|---|---|---|
| Labour | Denis Knowles | 1,454 | 55.4 | ||
| Liberal Democrats | James Robinson | 814 | 31.0 | ||
| Conservative | Patricia Jones | 331 | 12.6 | ||
| Green | Perle Sheldricks | 26 | 1.0 | New | |
| Majority | 640 | 24.4 | |||
| Registered electors | 10,728 | ||||
| Turnout | 24.7 | ||||
| Labour hold | Swing | ||||
Thurstaston
| Party | Candidate | Votes | % | ± | |
|---|---|---|---|---|---|
| Conservative | David Elderton | 2,508 | 64.0 | ||
| Labour | David Kean | 856 | 21.9 | ||
| Liberal Democrats | Charles Wall | 408 | 10.4 | ||
| Green | Percy Hogg | 145 | 3.7 | ||
| Majority | 1,652 | 42.2 | |||
| Registered electors | 12,605 | ||||
| Turnout | 31.1 | ||||
| Conservative hold | Swing | ||||
Tranmere
| Party | Candidate | Votes | % | ± | |
|---|---|---|---|---|---|
| Labour | Moira McLaughlin | 893 | 68.5 | ||
| Conservative | Susan Bebell | 204 | 15.6 | ||
| Liberal Democrats | Christopher Teggin | 127 | 9.7 | ||
| Green | Angela Upton | 80 | 6.1 | ||
| Majority | 689 | 52.8 | |||
| Registered electors | 9,036 | ||||
| Turnout | 14.5 | ||||
| Labour hold | Swing | ||||
Upton
| Party | Candidate | Votes | % | ± | |
|---|---|---|---|---|---|
| Labour | Susan Brown | 1,461 | 49.9 | ||
| Conservative | Marcus Darby | 1,050 | 35.9 | ||
| Liberal Democrats | Christopher Beazer | 309 | 10.6 | ||
| Green | Joyce Hogg | 106 | 3.6 | ||
| Majority | 411 | 14.0 | |||
| Registered electors | 12,336 | ||||
| Turnout | 23.7 | ||||
| Labour hold | Swing | ||||
Wallasey
| Party | Candidate | Votes | % | ± | |
|---|---|---|---|---|---|
| Conservative | Kate Wood | 2,774 | 72.0 | ||
| Labour | Margaret Allen | 698 | 18.1 | ||
| Liberal Democrats | John Uriel | 383 | 9.9 | ||
| Majority | 2,076 | 53.9 | |||
| Registered electors | 12,011 | ||||
| Turnout | 32.2 | ||||
| Conservative hold | Swing | ||||
Changes between 2000 and 2002
| Date | Ward | Name | Previous affiliation | New affiliation | Circumstance | ||
|---|---|---|---|---|---|---|---|
| December 2001 | Egerton | Colin Dow | Labour | Independent | Whip removed.[24] | ||
| February 2002 | Bebington | Kath Shaughnessy | Labour | Independent | Resigned.[24] | ||
Notes
• italics denote the sitting councillor • bold denotes the winning candidate
gollark: So it should be able to under mostly single-thread loads.
gollark: It says it can go up to 3.10GHz.
gollark: Cost ≠ value, as they say.
gollark: "value""Windows"
gollark: It would be a very nice SBC SoC.
References
- "Local Election Summaries 2000". The Elections Centre. Retrieved 26 December 2018.
- "Metropolitan Borough of Wirral Election Results 1973-2012 (Pg. 15 and 16)" (PDF). The Elections Centre. Retrieved 26 December 2018.
- "Council compositions". The Elections Centre. Retrieved 27 July 2018.
- "Councillor Jerry Williams". Wirral Metropolitan Borough Council.
- "Councillor Jim Crabtree". Wirral Metropolitan Borough Council.
- "Councillor Jean Stapleton". Wirral Metropolitan Borough Council.
- "Councillor Bob Moon". Wirral Metropolitan Borough Council.
- "Councillor George Davies". Wirral Metropolitan Borough Council.
- "Councillor Phil Gilchrist". Wirral Metropolitan Borough Council.
- "Councillor Les Rowlands". Wirral Metropolitan Borough Council.
- "Councillor Ron Abbey". Wirral Metropolitan Borough Council.
- "Councillor Simon R Mountney". Wirral Metropolitan Borough Council.
- "Councillor Denis Knowles". Wirral Metropolitan Borough Council.
- "Councillor Chris Blakeley". Wirral Metropolitan Borough Council.
- "Councillor Ann McLachlan". Wirral Metropolitan Borough Council.
- "Councillor Tony Pritchard". Wirral Metropolitan Borough Council.
- "Councillor John Salter". Wirral Metropolitan Borough Council.
- "Councillor Ann Bridson". Wirral Metropolitan Borough Council.
- "Councillor Peter Reisdorf". Wirral Metropolitan Borough Council.
- "Labour hangs on to a tiny majority". Wirral Globe. Retrieved 26 December 2018.
- "Councillor David M Elderton". Wirral Metropolitan Borough Council.
- "Councillor Moira McLaughlin". Wirral Metropolitan Borough Council.
- "Councillor Kate Wood". Wirral Metropolitan Borough Council.
- "Second councillor quits". Wirral Globe. 12 February 2002. Retrieved 28 December 2018.
"Everything to play for in local polls". Wirral Globe. 4 May 2000. Retrieved 29 December 2018.
This article is issued from Wikipedia. The text is licensed under Creative Commons - Attribution - Sharealike. Additional terms may apply for the media files.


