2000 Exeter City Council election
The 2000 Exeter City Council election took place on 4 May 2000, to elect members of Exeter City Council in England. The entire council was up for election following boundary changes, which increase the number of seats from 36 to 40. The election was held concurrently with other local elections in England. The Labour Party retained control of the council, which it had held since 1995.[3]
| |||||||||||||||||||||||||||||||||||||||||
All 40 seats to Exeter City Council 21 seats needed for a majority | |||||||||||||||||||||||||||||||||||||||||
|---|---|---|---|---|---|---|---|---|---|---|---|---|---|---|---|---|---|---|---|---|---|---|---|---|---|---|---|---|---|---|---|---|---|---|---|---|---|---|---|---|---|
| Turnout | 34.0% | ||||||||||||||||||||||||||||||||||||||||
| |||||||||||||||||||||||||||||||||||||||||
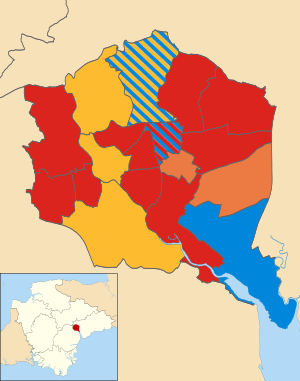 Map showing the results the 2000 Exeter City Council elections by ward. Red shows Labour seats, blue shows the Conservatives, yellow shows the Liberal Democrats and orange shows the Liberals. Striped wards indicate seats shared between parties. | |||||||||||||||||||||||||||||||||||||||||
| |||||||||||||||||||||||||||||||||||||||||
Ward results
Alphington (3)
| Party | Candidate | Votes | % | |
|---|---|---|---|---|
| Liberal Democrats | M. Browning | 1,492 | ||
| Liberal Democrats | P. Wadham | 1,053 | ||
| Liberal Democrats | P. Smith | 960 | ||
| Conservative | M. Jordan | 515 | ||
| Labour | M. Hammond | 396 | ||
| Labour | M. Walker | 377 | ||
| Conservative | E. Ives | 376 | ||
| Conservative | R. Sclater | 365 | ||
| Labour | A. Hart | 318 | ||
| Turnout | 2,672 | 35.7% | ||
Cowick (2)
| Party | Candidate | Votes | % | |
|---|---|---|---|---|
| Labour | M. Mills | 672 | ||
| Labour | B. Robson | 571 | ||
| Conservative | G. Spivey | 504 | ||
| Liberal Democrats | B. Wilcox | 211 | ||
| Liberal Democrats | S. Wilcox | 160 | ||
| Green | B. Knibbs | 136 | ||
| Turnout | 31.6% | |||
Duryard (2)
| Party | Candidate | Votes | % | |
|---|---|---|---|---|
| Liberal Democrats | C. Luxton | 534 | ||
| Liberal Democrats | A. Dalby | 497 | ||
| Conservative | S. Syvret | 346 | ||
| Labour | D. Parker | 224 | ||
| Labour | L. Powell | 187 | ||
| Turnout | 23.8% | |||
Exwick (3)
| Party | Candidate | Votes | % | |
|---|---|---|---|---|
| Labour | H. Slack | 838 | ||
| Labour | R. Slack | 794 | ||
| Labour | H. Catton | 715 | ||
| Conservative | P. Johnson | 364 | ||
| Conservative | C. Wilkins | 338 | ||
| Liberal Democrats | J. Goddard | 267 | ||
| Green | M. Hawkes | 253 | ||
| Liberal Democrats | N. Goddard | 245 | ||
| Registered electors | 7,197 | |||
| Turnout | 23.9% | |||
Heavitree (2)
| Party | Candidate | Votes | % | |
|---|---|---|---|---|
| Liberal | D. Morrish | 1,062 | ||
| Liberal | P. Bennett | 638 | ||
| Liberal Democrats | S. Hobden | 578 | ||
| Conservative | D. Hambrook | 313 | ||
| Liberal Democrats | M. Bransby-Williams | 311 | ||
| Labour | I. Martin | 276 | ||
| Labour | D. Dewar | 250 | ||
| Green | J. Hayward | 93 | ||
| Turnout | 45.7% | |||
Mincinglake (2)
| Party | Candidate | Votes | % | |
|---|---|---|---|---|
| Labour | A. Dean | 606 | ||
| Labour | P. Oliver | 560 | ||
| Conservative | J. Hedley | 312 | ||
| Liberal Democrats | A. Soper | 219 | ||
| Turnout | 25.1% | |||
Newtown (2)
| Party | Candidate | Votes | % | |
|---|---|---|---|---|
| Labour | R. Branstone | 565 | ||
| Labour | P. Shepherd | 558 | ||
| Conservative | D. Henson | 314 | ||
| Conservative | B. Coleman | 281 | ||
| Liberal Democrats | S. Boult | 246 | ||
| Liberal Democrats | T. Thompson | 227 | ||
| Green | A. Thomas | 180 | ||
| Liberal | J. Bahrij | 46 | ||
| Turnout | 30.7% | |||
Pennsylvania (2)
| Party | Candidate | Votes | % | |
|---|---|---|---|---|
| Conservative | J. Coates | 554 | ||
| Liberal Democrats | J. Holman | 529 | ||
| Liberal Democrats | D. Treharne | 486 | ||
| Labour | K. Moore | 480 | ||
| Conservative | J. Brandon | 473 | ||
| Labour | Sterry H. | 436 | ||
| Green | S. Dunstan | 127 | ||
| Turnout | 37.7% | |||
Pinhoe (2)
| Party | Candidate | Votes | % | |
|---|---|---|---|---|
| Labour | V. Dixon | 871 | ||
| Labour | B. McNamara | 760 | ||
| Conservative | J. Frappell | 709 | ||
| Liberal Democrats | P. Holman | 543 | ||
| Turnout | 38.4% | |||
Polsloe (2)
| Party | Candidate | Votes | % | |
|---|---|---|---|---|
| Labour | R. Lyons | 615 | ||
| Conservative | Y. Henson | 558 | ||
| Labour | G. Sheldon | 552 | ||
| Conservative | J. Farquaharson | 462 | ||
| Liberal Democrats | C. Miller | 279 | ||
| Turnout | 30.3% | |||
Priory (3)
| Party | Candidate | Votes | % | |
|---|---|---|---|---|
| Labour | O. Foggin | 985 | ||
| Labour | M. Baldwin | 943 | ||
| Labour | M. Midgely | 936 | ||
| Conservative | A. Leadbetter | 368 | ||
| Conservative | S. Bunting | 353 | ||
| Liberal | J. Spicer | 350 | ||
| Liberal | E. McCord | 328 | ||
| Liberal | D. Firminger | 314 | ||
| Liberal Democrats | S. Barratt | 249 | ||
| Green | M-A. Moors | 121 | ||
| Turnout | 30.1% | |||
St Davids (2)
| Party | Candidate | Votes | % | |
|---|---|---|---|---|
| Liberal Democrats | P. Brock | 585 | ||
| Liberal Democrats | S. Brock | 489 | ||
| Labour | E. Jarvis | 390 | ||
| Labour | B. Steane | 350 | ||
| Conservative | G. Williams | 195 | ||
| Green | A. Bruins | 145 | ||
| Turnout | 35.4% | |||
St James (2)
| Party | Candidate | Votes | % | |
|---|---|---|---|---|
| Labour | M. Griffiths | 616 | ||
| Labour | M. Choules | 476 | ||
| Green | T. Brenan | 291 | ||
| Conservative | G. Hedley | 254 | ||
| Conservative | J. Macdonald | 251 | ||
| Liberal Democrats | P. Brock | 585 | ||
| Liberal Democrats | S. Brock | 489 | ||
| Turnout | 26.1% | |||
St Leonards (2)
| Party | Candidate | Votes | % | |
|---|---|---|---|---|
| Conservative | N. Shiel | 830 | ||
| Conservative | J. Winterbottom | 731 | ||
| Labour | R. Snowden | 567 | ||
| Labour | N. Baldwin | 533 | ||
| Liberal Democrats | R. Ruffle | 309 | ||
| Liberal Democrats | D. Laming | 276 | ||
| Turnout | 47.2% | |||
St Loye (2)
}}
| Party | Candidate | Votes | % | |
|---|---|---|---|---|
| Liberal | D. Morrish | 785 | ||
| Liberal | M. Danks | 671 | ||
| Conservative | H. Arden | 270 | ||
| Conservative | N. Le Gallais | 204 | ||
| Labour | C. Gale | 161 | ||
| Labour | C. Hemming | 151 | ||
| Liberal Democrats | T. Reves | 40 | ||
| Turnout | 33.6% | |||
St Thomas (2)
| Party | Candidate | Votes | % | |
|---|---|---|---|---|
| Labour | R. Hill | 779 | ||
| Labour | C. Boyle | 675 | ||
| Liberal Democrats | A. Fullam | 404 | ||
| Liberal Democrats | N. Tremlett | 367 | ||
| Conservative | R. Edwardson | 171 | ||
| Conservative | G. Sclater | 159 | ||
| Green | K. Morris | 95 | ||
| Turnout | 32.8% | |||
Topsham (2)
| Party | Candidate | Votes | % | |
|---|---|---|---|---|
| Conservative | M. Evans | 1,517 | ||
| Conservative | D. Carr | 914 | ||
| Liberal Democrats | D. Ballanyne | 851 | ||
| Labour | D. Baldwin | 273 | ||
| Labour | K. Owen | 237 | ||
| Green | O. Michaelson | 207 | ||
| Turnout | 52.8% | |||
Whipton & Barton (3)
| Party | Candidate | Votes | % | |
|---|---|---|---|---|
| Labour | V. Long | 939 | ||
| Labour | C. McNamara | 927 | ||
| Labour | P. Edwards | 916 | ||
| Conservative | J. White | 435 | ||
| Conservative | P. White | 406 | ||
| Liberal | E. Timms | 398 | ||
| Liberal | A. Searle | 364 | ||
| Liberal | K. Danks | 357 | ||
| Liberal Democrats | A. Palmer | 149 | ||
| Turnout | 31.7% | |||
gollark: Early cash money™ for a new investmnet?
gollark: Nope. It is automatically sold after 4 hours.
gollark: Like this, but the opposite.
gollark: You get meme cash money dank bucks.
gollark: Hey, it looks like the old ME still has no rules against bots and quite likely more exciting economic exploits!
References
- Rallings, Colin; Thrasher, Michael (2015). Exeter City Council Election Results 1973-2012 (PDF). University of Plymouth, Plymouth, UK: The Elections Centre. p. 8-9.
- Rallings, Colin; Thrasher, Michael (2000). Local Elections Handbook 2000 (PDF). University of Plymouth, Plymouth, UK: Local Government Chronicle Elections Centre. p. 5.
- "Local Elections 2000". BBC News.
This article is issued from Wikipedia. The text is licensed under Creative Commons - Attribution - Sharealike. Additional terms may apply for the media files.