1952 United States presidential election in Pennsylvania
The 1952 United States presidential election in Pennsylvania took place on November 4, 1952 as part of the 1952 United States presidential election. Voters chose 32 representatives, or electors to the Electoral College, who voted for president and vice president.
| ||||||||||||||||||||||||||
| ||||||||||||||||||||||||||
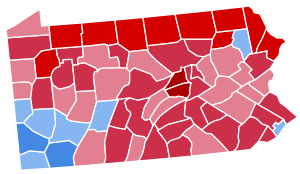
 County Results
| ||||||||||||||||||||||||||
| ||||||||||||||||||||||||||
| Elections in Pennsylvania | ||||||||||||||
|---|---|---|---|---|---|---|---|---|---|---|---|---|---|---|
 | ||||||||||||||
|
||||||||||||||
|
||||||||||||||
|
||||||||||||||
|
||||||||||||||
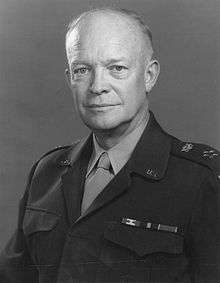
Pennsylvania voted for the Republican nominee, war hero General Dwight D. Eisenhower, over the Democratic nominee, Illinois Governor Adlai Stevenson. Eisenhower won Pennsylvania by a margin of 5.89%.
Results
| 1952 United States presidential election in Pennsylvania[2] | |||||
|---|---|---|---|---|---|
| Party | Candidate | Votes | Percentage | Electoral votes | |
| Republican | Dwight D. Eisenhower | 2,415,789 | 52.74% | 32 | |
| Democratic | Adlai Stevenson | 2,146,269 | 46.85% | 0 | |
| Prohibition | Stuart Hamblen | 8,951 | 0.20% | 0 | |
| Progressive | Vincent Hallinan | 4,222 | 0.09% | 0 | |
| Socialist | Darlington Hoopes | 2,698 | 0.06% | 0 | |
| Militant Workers | Farrell Dobbs | 1,508 | 0.03% | 0 | |
| Industrial Government | Eric Hass | 1,377 | 0.03% | 0 | |
| Write-ins | Write-ins | 155 | 0.00% | 0 | |
Results by county
| County | Dwight David Eisenhower Republican |
Adlai Ewing Stevenson II Democratic |
Various candidates Other parties |
Margin | Total votes cast[3] | ||||
|---|---|---|---|---|---|---|---|---|---|
| # | % | # | % | # | % | # | % | ||
| Adams | 11,016 | 65.82% | 5,691 | 34.00% | 30 | 0.18% | 5,325 | 31.82% | 16,737 |
| Allegheny | 359,224 | 49.00% | 370,945 | 50.60% | 2,903 | 0.40% | -11,721 | -1.60% | 733,072 |
| Armstrong | 16,955 | 55.90% | 13,221 | 43.59% | 153 | 0.50% | 3,734 | 12.31% | 30,329 |
| Beaver | 31,700 | 45.18% | 38,136 | 54.35% | 334 | 0.48% | -6,436 | -9.17% | 70,170 |
| Bedford | 9,419 | 63.93% | 5,255 | 35.67% | 60 | 0.41% | 4,164 | 28.26% | 14,734 |
| Berks | 51,720 | 52.42% | 45,874 | 46.49% | 1,074 | 1.09% | 5,846 | 5.92% | 98,668 |
| Blair | 32,113 | 65.44% | 16,851 | 34.34% | 106 | 0.22% | 15,262 | 31.10% | 49,070 |
| Bradford | 15,894 | 76.02% | 4,959 | 23.72% | 55 | 0.26% | 10,935 | 52.30% | 20,908 |
| Bucks | 40,753 | 62.38% | 24,301 | 37.20% | 275 | 0.42% | 16,452 | 25.18% | 65,329 |
| Butler | 25,243 | 61.99% | 15,295 | 37.56% | 185 | 0.45% | 9,948 | 24.43% | 40,723 |
| Cambria | 39,294 | 43.54% | 50,774 | 56.26% | 182 | 0.20% | -11,480 | -12.72% | 90,250 |
| Cameron | 2,307 | 69.05% | 1,020 | 30.53% | 14 | 0.42% | 1,287 | 38.52% | 3,341 |
| Carbon | 12,283 | 53.43% | 10,571 | 45.98% | 134 | 0.58% | 1,712 | 7.45% | 22,988 |
| Centre | 14,700 | 66.31% | 7,391 | 33.34% | 77 | 0.35% | 7,309 | 32.97% | 22,168 |
| Chester | 39,961 | 64.86% | 21,490 | 34.88% | 164 | 0.27% | 18,471 | 29.98% | 61,615 |
| Clarion | 9,340 | 63.76% | 5,212 | 35.58% | 97 | 0.66% | 4,128 | 28.18% | 14,649 |
| Clearfield | 16,045 | 54.25% | 13,376 | 45.22% | 156 | 0.53% | 2,669 | 9.02% | 29,577 |
| Clinton | 8,125 | 58.29% | 5,758 | 41.31% | 55 | 0.39% | 2,367 | 16.98% | 13,938 |
| Columbia | 13,008 | 57.67% | 9,467 | 41.97% | 79 | 0.35% | 3,541 | 15.70% | 22,554 |
| Crawford | 19,079 | 65.49% | 9,874 | 33.89% | 181 | 0.62% | 9,205 | 31.60% | 29,134 |
| Cumberland | 26,302 | 67.17% | 12,762 | 32.59% | 91 | 0.23% | 13,540 | 34.58% | 39,155 |
| Dauphin | 58,385 | 65.12% | 30,985 | 34.56% | 286 | 0.32% | 27,400 | 30.56% | 89,656 |
| Delaware | 129,743 | 61.56% | 80,316 | 38.11% | 689 | 0.33% | 49,427 | 23.45% | 210,748 |
| Elk | 7,702 | 54.26% | 6,448 | 45.42% | 45 | 0.32% | 1,254 | 8.83% | 14,195 |
| Erie | 48,836 | 56.89% | 36,619 | 42.66% | 391 | 0.46% | 12,217 | 14.23% | 85,846 |
| Fayette | 27,348 | 38.12% | 43,921 | 61.22% | 476 | 0.66% | -16,573 | -23.10% | 71,745 |
| Forest | 1,511 | 69.92% | 627 | 29.01% | 23 | 1.06% | 884 | 40.91% | 2,161 |
| Franklin | 16,474 | 64.82% | 8,868 | 34.89% | 74 | 0.29% | 7,606 | 29.93% | 25,416 |
| Fulton | 2,127 | 55.12% | 1,718 | 44.52% | 14 | 0.36% | 409 | 10.60% | 3,859 |
| Greene | 6,964 | 40.68% | 10,125 | 59.14% | 30 | 0.18% | -3,161 | -18.46% | 17,119 |
| Huntingdon | 9,580 | 68.61% | 4,318 | 30.93% | 64 | 0.46% | 5,262 | 37.69% | 13,962 |
| Indiana | 16,673 | 58.63% | 11,620 | 40.86% | 147 | 0.52% | 5,053 | 17.77% | 28,440 |
| Jefferson | 11,833 | 64.61% | 6,365 | 34.75% | 116 | 0.63% | 5,468 | 29.86% | 18,314 |
| Juniata | 3,863 | 58.63% | 2,705 | 41.05% | 21 | 0.32% | 1,158 | 17.57% | 6,589 |
| Lackawanna | 61,644 | 48.65% | 64,926 | 51.24% | 147 | 0.12% | -3,282 | -2.59% | 126,717 |
| Lancaster | 64,193 | 69.23% | 28,146 | 30.36% | 382 | 0.41% | 36,047 | 38.88% | 92,721 |
| Lawrence | 23,319 | 52.12% | 21,164 | 47.31% | 255 | 0.57% | 2,155 | 4.82% | 44,738 |
| Lebanon | 20,726 | 63.83% | 11,611 | 35.76% | 135 | 0.42% | 9,115 | 28.07% | 32,472 |
| Lehigh | 45,143 | 57.52% | 33,033 | 42.09% | 303 | 0.39% | 12,110 | 15.43% | 78,479 |
| Luzerne | 88,967 | 54.83% | 72,579 | 44.73% | 715 | 0.44% | 16,388 | 10.10% | 162,261 |
| Lycoming | 25,753 | 61.60% | 15,870 | 37.96% | 184 | 0.44% | 9,883 | 23.64% | 41,807 |
| McKean | 15,256 | 73.43% | 5,373 | 25.86% | 147 | 0.71% | 9,883 | 47.57% | 20,776 |
| Mercer | 26,424 | 55.59% | 20,770 | 43.69% | 343 | 0.72% | 5,654 | 11.89% | 47,537 |
| Mifflin | 8,620 | 59.22% | 5,889 | 40.46% | 47 | 0.32% | 2,731 | 18.76% | 14,556 |
| Monroe | 9,502 | 62.09% | 5,760 | 37.64% | 42 | 0.27% | 3,742 | 24.45% | 15,304 |
| Montgomery | 115,899 | 66.62% | 57,701 | 33.17% | 373 | 0.21% | 58,198 | 33.45% | 173,973 |
| Montour | 3,725 | 62.12% | 2,264 | 37.76% | 7 | 0.12% | 1,461 | 24.37% | 5,996 |
| Northampton | 39,131 | 50.99% | 36,993 | 48.21% | 614 | 0.80% | 2,138 | 2.79% | 76,738 |
| Northumberland | 28,861 | 61.71% | 17,789 | 38.04% | 119 | 0.25% | 11,072 | 23.67% | 46,769 |
| Perry | 6,733 | 68.76% | 3,042 | 31.07% | 17 | 0.17% | 3,691 | 37.69% | 9,792 |
| Philadelphia | 396,874 | 41.40% | 557,352 | 58.15% | 4,321 | 0.45% | -160,478 | -16.74% | 958,547 |
| Pike | 3,810 | 73.21% | 1,383 | 26.58% | 11 | 0.21% | 2,427 | 46.64% | 5,204 |
| Potter | 5,117 | 71.78% | 1,974 | 27.69% | 38 | 0.53% | 3,143 | 44.09% | 7,129 |
| Schuylkill | 51,437 | 59.39% | 34,987 | 40.40% | 186 | 0.21% | 16,450 | 18.99% | 86,610 |
| Snyder | 6,836 | 80.00% | 1,686 | 19.73% | 23 | 0.27% | 5,150 | 60.27% | 8,545 |
| Somerset | 18,589 | 58.42% | 13,167 | 41.38% | 64 | 0.20% | 5,422 | 17.04% | 31,820 |
| Sullivan | 2,011 | 61.82% | 1,239 | 38.09% | 3 | 0.09% | 772 | 23.73% | 3,253 |
| Susquehanna | 10,529 | 73.97% | 3,653 | 25.66% | 52 | 0.37% | 6,876 | 48.31% | 14,234 |
| Tioga | 11,203 | 78.65% | 3,006 | 21.10% | 35 | 0.25% | 8,197 | 57.55% | 14,244 |
| Union | 6,558 | 80.16% | 1,610 | 19.68% | 13 | 0.16% | 4,948 | 60.48% | 8,181 |
| Venango | 17,006 | 72.16% | 6,356 | 26.97% | 204 | 0.87% | 10,650 | 45.19% | 23,566 |
| Warren | 11,555 | 71.55% | 4,442 | 27.50% | 153 | 0.95% | 7,113 | 44.04% | 16,150 |
| Washington | 36,041 | 39.16% | 55,725 | 60.55% | 270 | 0.29% | -19,684 | -21.39% | 92,036 |
| Wayne | 9,623 | 78.96% | 2,530 | 20.76% | 34 | 0.28% | 7,093 | 58.20% | 12,187 |
| Westmoreland | 58,923 | 42.24% | 80,068 | 57.40% | 503 | 0.36% | -21,145 | -15.16% | 139,494 |
| Wyoming | 5,772 | 75.72% | 1,815 | 23.81% | 36 | 0.47% | 3,957 | 51.91% | 7,623 |
| York | 44,489 | 52.74% | 39,508 | 46.84% | 354 | 0.42% | 4,981 | 5.91% | 84,351 |
| Totals | 2,415,789 | 52.74% | 2,146,269 | 46.85% | 18,911 | 0.41% | 269,520 | 5.88% | 4,580,969 |
gollark: True, true.
gollark: Lua's Turing-complete, after all.
gollark: Justyn: pretty sure it is possible but hard.
gollark: Make one what? Tape encoder?
gollark: I have a library for writing arbitrary data (even functions!) to tape, it makes HORRIBLE-SOUNDING tapes.
References
- "U.S. presidential election, 1952". Facts on File. Archived from the original on October 29, 2013. Retrieved October 24, 2013.
Eisenhower, born in Texas, considered a resident of New York, and headquartered at the time in Paris, finally decided to run for the Republican nomination
- David Leip. "1952 Presidential General Election Results – Pennsylvania". Dave Leip’s U.S. Election Atlas. Retrieved 2018-03-25.
- Scammon, Richard M. (compiler); America at the Polls: A Handbook of Presidential Election Statistics 1920-1964; pp. 385-386 ISBN 0405077114
This article is issued from Wikipedia. The text is licensed under Creative Commons - Attribution - Sharealike. Additional terms may apply for the media files.


