1928 United States presidential election in Kansas
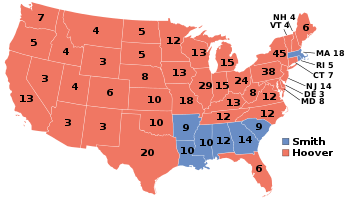
The 1928 United States presidential election in Kansas took place on November 6, 1928, as part of the 1928 United States Presidential Election which was held throughout all contemporary 48 states. Voters chose ten representatives, or electors to the Electoral College, who voted for president and vice president.
| ||||||||||||||||||||||||||
| ||||||||||||||||||||||||||
| ||||||||||||||||||||||||||
| Elections in Kansas | ||||||||||
|---|---|---|---|---|---|---|---|---|---|---|
 | ||||||||||
|
||||||||||
|
||||||||||
|
Ballot measures
|
||||||||||
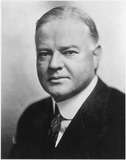
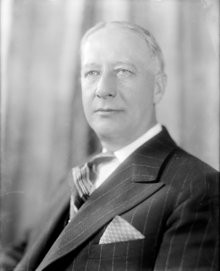
Kansas voted for the Republican nominee, Secretary of Commerce Herbert Hoover of California, over the Democratic nominee, Governor Alfred E. Smith of New York. Hoover's running mate was Senate Majority Leader Charles Curtis of Kansas, while Smith ran with Senator Joseph Taylor Robinson of Arkansas. Hoover won the by a margin of 44.96%.
Smith only carried Ellis County, which had (and still has) a large percentage of Roman Catholic residents. Smith was the first Roman Catholic to earn the nomination of a major party for president.
With 72.02% of the popular vote, Kansas would prove to be Hoover's strongest state in the 1928 presidential election in terms of popular vote percentage.[1]
Results
| 1928 United States presidential election in Kansas[2] | ||||||||
|---|---|---|---|---|---|---|---|---|
| Party | Candidate | Running mate | Popular vote | Electoral vote | ||||
| Count | % | Count | % | |||||
| Republican | Herbert Hoover of California | Charles Curtis of Kansas | 513,672 | 72.02% | 10 | 100.00% | ||
| Democratic | Al Smith of New York | Joseph Taylor Robinson of Arkansas | 193,003 | 27.06% | 0 | 0.00% | ||
| Socialist | Norman Thomas of New York | James Hudson Maurer of Pennsylvania | 6,205 | 0.87% | 0 | 0.00% | ||
| Communist | William Z. Foster of Massachusetts | Benjamin Gitlow of New York | 320 | 0.04% | 0 | 0.00% | ||
| Total | 713,200 | 100.00% | 10 | 100.00% | ||||
Results by county
| County | Herbert Clark Hoover Republican |
Alfred Emmanuel Smith Democratic |
Various candidates Other parties |
Margin | Total votes cast[3] | ||||
|---|---|---|---|---|---|---|---|---|---|
| # | % | # | % | # | % | # | % | ||
| Allen | 6,695 | 78.30% | 1,803 | 21.09% | 52 | 0.61% | 4,892 | 57.22% | 8,550 |
| Anderson | 3,562 | 64.94% | 1,874 | 34.17% | 49 | 0.89% | 1,688 | 30.77% | 5,485 |
| Atchison | 6,647 | 63.67% | 3,756 | 35.98% | 37 | 0.35% | 2,891 | 27.69% | 10,440 |
| Barber | 2,984 | 76.43% | 871 | 22.31% | 49 | 1.26% | 2,113 | 54.12% | 3,904 |
| Barton | 4,966 | 63.94% | 2,777 | 35.75% | 24 | 0.31% | 2,189 | 28.18% | 7,767 |
| Bourbon | 7,251 | 75.88% | 2,223 | 23.26% | 82 | 0.86% | 5,028 | 52.62% | 9,556 |
| Brown | 6,692 | 76.77% | 2,005 | 23.00% | 20 | 0.23% | 4,687 | 53.77% | 8,717 |
| Butler | 10,168 | 79.43% | 2,533 | 19.79% | 101 | 0.79% | 7,635 | 59.64% | 12,802 |
| Chase | 2,079 | 72.79% | 739 | 25.88% | 38 | 1.33% | 1,340 | 46.92% | 2,856 |
| Chautauqua | 3,303 | 75.97% | 944 | 21.71% | 101 | 2.32% | 2,359 | 54.25% | 4,348 |
| Cherokee | 7,478 | 66.20% | 3,442 | 30.47% | 376 | 3.33% | 4,036 | 35.73% | 11,296 |
| Cheyenne | 1,466 | 69.61% | 586 | 27.83% | 54 | 2.56% | 880 | 41.79% | 2,106 |
| Clark | 1,383 | 76.41% | 419 | 23.15% | 8 | 0.44% | 964 | 53.26% | 1,810 |
| Clay | 4,457 | 73.74% | 1,515 | 25.07% | 72 | 1.19% | 2,942 | 48.68% | 6,044 |
| Cloud | 5,286 | 68.25% | 2,376 | 30.68% | 83 | 1.07% | 2,910 | 37.57% | 7,745 |
| Coffey | 4,342 | 73.81% | 1,514 | 25.74% | 27 | 0.46% | 2,828 | 48.07% | 5,883 |
| Comanche | 1,554 | 79.98% | 385 | 19.81% | 4 | 0.21% | 1,169 | 60.16% | 1,943 |
| Cowley | 12,701 | 80.79% | 2,818 | 17.93% | 202 | 1.28% | 9,883 | 62.86% | 15,721 |
| Crawford | 10,992 | 62.31% | 6,351 | 36.00% | 299 | 1.69% | 4,641 | 26.31% | 17,642 |
| Decatur | 2,314 | 66.53% | 1,129 | 32.46% | 35 | 1.01% | 1,185 | 34.07% | 3,478 |
| Dickinson | 7,758 | 77.04% | 2,246 | 22.30% | 66 | 0.66% | 5,512 | 54.74% | 10,070 |
| Doniphan | 4,002 | 72.64% | 1,496 | 27.16% | 11 | 0.20% | 2,506 | 45.49% | 5,509 |
| Douglas | 8,887 | 78.70% | 2,297 | 20.34% | 108 | 0.96% | 6,590 | 58.36% | 11,292 |
| Edwards | 2,171 | 73.37% | 768 | 25.95% | 20 | 0.68% | 1,403 | 47.41% | 2,959 |
| Elk | 3,007 | 77.50% | 831 | 21.42% | 42 | 1.08% | 2,176 | 56.08% | 3,880 |
| Ellis | 1,700 | 33.50% | 3,364 | 66.29% | 11 | 0.22% | -1,664 | -32.79% | 5,075 |
| Ellsworth | 2,450 | 60.23% | 1,588 | 39.04% | 30 | 0.74% | 862 | 21.19% | 4,068 |
| Finney | 2,433 | 76.65% | 709 | 22.34% | 32 | 1.01% | 1,724 | 54.32% | 3,174 |
| Ford | 4,893 | 71.59% | 1,870 | 27.36% | 72 | 1.05% | 3,023 | 44.23% | 6,835 |
| Franklin | 7,346 | 78.40% | 1,951 | 20.82% | 73 | 0.78% | 5,395 | 57.58% | 9,370 |
| Geary | 2,746 | 69.15% | 1,203 | 30.29% | 22 | 0.55% | 1,543 | 38.86% | 3,971 |
| Gove | 1,470 | 70.95% | 590 | 28.47% | 12 | 0.58% | 880 | 42.47% | 2,072 |
| Graham | 1,832 | 61.68% | 1,087 | 36.60% | 51 | 1.72% | 745 | 25.08% | 2,970 |
| Grant | 635 | 76.41% | 185 | 22.26% | 11 | 1.32% | 450 | 54.15% | 831 |
| Gray | 1,294 | 67.47% | 606 | 31.60% | 18 | 0.94% | 688 | 35.87% | 1,918 |
| Greeley | 439 | 78.25% | 121 | 21.57% | 1 | 0.18% | 318 | 56.68% | 561 |
| Greenwood | 5,863 | 78.53% | 1,554 | 20.81% | 49 | 0.66% | 4,309 | 57.71% | 7,466 |
| Hamilton | 839 | 68.43% | 363 | 29.61% | 24 | 1.96% | 476 | 38.83% | 1,226 |
| Harper | 3,712 | 77.85% | 1,005 | 21.08% | 51 | 1.07% | 2,707 | 56.77% | 4,768 |
| Harvey | 6,330 | 77.62% | 1,748 | 21.43% | 77 | 0.94% | 4,582 | 56.19% | 8,155 |
| Haskell | 646 | 73.41% | 222 | 25.23% | 12 | 1.36% | 424 | 48.18% | 880 |
| Hodgeman | 1,122 | 67.55% | 528 | 31.79% | 11 | 0.66% | 594 | 35.76% | 1,661 |
| Jackson | 4,811 | 74.55% | 1,602 | 24.83% | 40 | 0.62% | 3,209 | 49.73% | 6,453 |
| Jefferson | 4,810 | 74.77% | 1,601 | 24.89% | 22 | 0.34% | 3,209 | 49.88% | 6,433 |
| Jewell | 4,583 | 76.90% | 1,289 | 21.63% | 88 | 1.48% | 3,294 | 55.27% | 5,960 |
| Johnson | 8,185 | 70.40% | 3,373 | 29.01% | 69 | 0.59% | 4,812 | 41.39% | 11,627 |
| Kearny | 854 | 77.22% | 229 | 20.71% | 23 | 2.08% | 625 | 56.51% | 1,106 |
| Kingman | 3,287 | 69.63% | 1,408 | 29.82% | 26 | 0.55% | 1,879 | 39.80% | 4,721 |
| Kiowa | 1,929 | 82.09% | 406 | 17.28% | 15 | 0.64% | 1,523 | 64.81% | 2,350 |
| Labette | 9,048 | 74.22% | 2,969 | 24.35% | 174 | 1.43% | 6,079 | 49.86% | 12,191 |
| Lane | 954 | 71.30% | 364 | 27.20% | 20 | 1.49% | 590 | 44.10% | 1,338 |
| Leavenworth | 8,472 | 56.27% | 6,539 | 43.43% | 45 | 0.30% | 1,933 | 12.84% | 15,056 |
| Lincoln | 2,655 | 73.12% | 953 | 26.25% | 23 | 0.63% | 1,702 | 46.87% | 3,631 |
| Linn | 4,231 | 75.19% | 1,328 | 23.60% | 68 | 1.21% | 2,903 | 51.59% | 5,627 |
| Logan | 1,066 | 71.64% | 405 | 27.22% | 17 | 1.14% | 661 | 44.42% | 1,488 |
| Lyon | 8,753 | 75.49% | 2,761 | 23.81% | 81 | 0.70% | 5,992 | 51.68% | 11,595 |
| Marion | 5,446 | 73.50% | 1,938 | 26.15% | 26 | 0.35% | 3,508 | 47.34% | 7,410 |
| Marshall | 6,918 | 67.06% | 3,329 | 32.27% | 69 | 0.67% | 3,589 | 34.79% | 10,316 |
| McPherson | 6,230 | 79.98% | 1,457 | 18.71% | 102 | 1.31% | 4,773 | 61.28% | 7,789 |
| Meade | 1,709 | 73.16% | 618 | 26.46% | 9 | 0.39% | 1,091 | 46.70% | 2,336 |
| Miami | 5,931 | 72.71% | 2,148 | 26.33% | 78 | 0.96% | 3,783 | 46.38% | 8,157 |
| Mitchell | 3,245 | 62.84% | 1,855 | 35.92% | 64 | 1.24% | 1,390 | 26.92% | 5,164 |
| Montgomery | 14,316 | 76.31% | 4,205 | 22.41% | 239 | 1.27% | 10,111 | 53.90% | 18,760 |
| Morris | 3,830 | 79.54% | 929 | 19.29% | 56 | 1.16% | 2,901 | 60.25% | 4,815 |
| Morton | 1,010 | 78.78% | 259 | 20.20% | 13 | 1.01% | 751 | 58.58% | 1,282 |
| Nemaha | 4,639 | 61.10% | 2,919 | 38.45% | 34 | 0.45% | 1,720 | 22.66% | 7,592 |
| Neosho | 6,603 | 72.27% | 2,459 | 26.92% | 74 | 0.81% | 4,144 | 45.36% | 9,136 |
| Ness | 2,058 | 71.51% | 784 | 27.24% | 36 | 1.25% | 1,274 | 44.27% | 2,878 |
| Norton | 3,365 | 73.99% | 1,087 | 23.90% | 96 | 2.11% | 2,278 | 50.09% | 4,548 |
| Osage | 5,900 | 73.24% | 2,058 | 25.55% | 98 | 1.22% | 3,842 | 47.69% | 8,056 |
| Osborne | 3,683 | 81.34% | 821 | 18.13% | 24 | 0.53% | 2,862 | 63.21% | 4,528 |
| Ottawa | 3,158 | 72.53% | 1,131 | 25.98% | 65 | 1.49% | 2,027 | 46.55% | 4,354 |
| Pawnee | 2,829 | 75.18% | 918 | 24.40% | 16 | 0.43% | 1,911 | 50.78% | 3,763 |
| Phillips | 3,206 | 69.77% | 1,332 | 28.99% | 57 | 1.24% | 1,874 | 40.78% | 4,595 |
| Pottawatomie | 4,451 | 65.30% | 2,341 | 34.35% | 24 | 0.35% | 2,110 | 30.96% | 6,816 |
| Pratt | 4,055 | 80.58% | 934 | 18.56% | 43 | 0.85% | 3,121 | 62.02% | 5,032 |
| Rawlins | 1,668 | 57.78% | 1,164 | 40.32% | 55 | 1.91% | 504 | 17.46% | 2,887 |
| Reno | 12,872 | 76.31% | 3,843 | 22.78% | 153 | 0.91% | 9,029 | 53.53% | 16,868 |
| Republic | 4,324 | 68.19% | 1,956 | 30.85% | 61 | 0.96% | 2,368 | 37.34% | 6,341 |
| Rice | 4,321 | 74.05% | 1,462 | 25.06% | 52 | 0.89% | 2,859 | 49.00% | 5,835 |
| Riley | 6,592 | 77.91% | 1,791 | 21.17% | 78 | 0.92% | 4,801 | 56.74% | 8,461 |
| Rooks | 2,583 | 70.73% | 1,044 | 28.59% | 25 | 0.68% | 1,539 | 42.14% | 3,652 |
| Rush | 1,985 | 60.02% | 1,296 | 39.19% | 26 | 0.79% | 689 | 20.83% | 3,307 |
| Russell | 2,782 | 66.56% | 1,366 | 32.68% | 32 | 0.77% | 1,416 | 33.88% | 4,180 |
| Saline | 7,872 | 71.20% | 3,108 | 28.11% | 76 | 0.69% | 4,764 | 43.09% | 11,056 |
| Scott | 886 | 65.78% | 450 | 33.41% | 11 | 0.82% | 436 | 32.37% | 1,347 |
| Sedgwick | 32,132 | 74.40% | 10,649 | 24.66% | 405 | 0.94% | 21,483 | 49.75% | 43,186 |
| Seward | 1,873 | 76.98% | 538 | 22.11% | 22 | 0.90% | 1,335 | 54.87% | 2,433 |
| Shawnee | 24,723 | 76.46% | 7,433 | 22.99% | 180 | 0.56% | 17,290 | 53.47% | 32,336 |
| Sheridan | 1,450 | 60.52% | 930 | 38.81% | 16 | 0.67% | 520 | 21.70% | 2,396 |
| Sherman | 2,028 | 74.61% | 630 | 23.18% | 60 | 2.21% | 1,398 | 51.43% | 2,718 |
| Smith | 4,021 | 74.34% | 1,338 | 24.74% | 50 | 0.92% | 2,683 | 49.60% | 5,409 |
| Stafford | 3,278 | 75.27% | 1,025 | 23.54% | 52 | 1.19% | 2,253 | 51.73% | 4,355 |
| Stanton | 497 | 74.85% | 164 | 24.70% | 3 | 0.45% | 333 | 50.15% | 664 |
| Stevens | 1,133 | 78.52% | 300 | 20.79% | 10 | 0.69% | 833 | 57.73% | 1,443 |
| Sumner | 8,951 | 79.64% | 2,108 | 18.75% | 181 | 1.61% | 6,843 | 60.88% | 11,240 |
| Thomas | 1,828 | 65.97% | 899 | 32.44% | 44 | 1.59% | 929 | 33.53% | 2,771 |
| Trego | 1,359 | 57.73% | 982 | 41.72% | 13 | 0.55% | 377 | 16.02% | 2,354 |
| Wabaunsee | 3,099 | 71.89% | 1,189 | 27.58% | 23 | 0.53% | 1,910 | 44.31% | 4,311 |
| Wallace | 738 | 66.19% | 356 | 31.93% | 21 | 1.88% | 382 | 34.26% | 1,115 |
| Washington | 4,781 | 67.37% | 2,267 | 31.94% | 49 | 0.69% | 2,514 | 35.42% | 7,097 |
| Wichita | 464 | 54.91% | 370 | 43.79% | 11 | 1.30% | 94 | 11.12% | 845 |
| Wilson | 5,603 | 78.46% | 1,465 | 20.52% | 73 | 1.02% | 4,138 | 57.95% | 7,141 |
| Woodson | 2,885 | 76.59% | 855 | 22.70% | 27 | 0.72% | 2,030 | 53.89% | 3,767 |
| Wyandotte | 32,829 | 65.69% | 16,884 | 33.78% | 265 | 0.53% | 15,945 | 31.90% | 49,978 |
| Totals | 513,672 | 72.02% | 193,003 | 27.06% | 6,525 | 0.91% | 320,669 | 44.96% | 713,200 |
References
- "1928 Presidential Election Statistics". Dave Leip’s Atlas of U.S. Presidential Elections. Retrieved 2018-03-05.
- "1928 Presidential General Election Results – Kansas". U.S. Election Atlas. Retrieved 23 December 2013.
- Scammon, Richard M. (compiler); America at the Polls: A Handbook of Presidential Election Statistics 1920–1964; pp. 165-166 ISBN 0405077114


