1928 United States presidential election in Minnesota
The 1928 United States presidential election in Minnesota took place on November 6, 1928 as part of the 1928 United States presidential election.
| ||||||||||||||||||||||||||
| ||||||||||||||||||||||||||
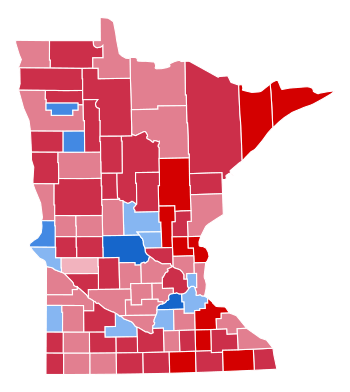
 County Results
| ||||||||||||||||||||||||||
| ||||||||||||||||||||||||||
| Elections in Minnesota | ||||||||||
|---|---|---|---|---|---|---|---|---|---|---|
 | ||||||||||
|
||||||||||
|
State executive elections
|
||||||||||
|
||||||||||
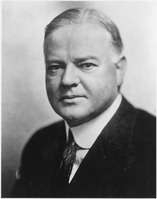
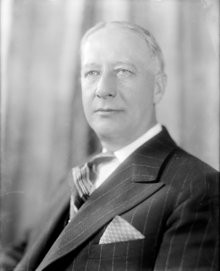
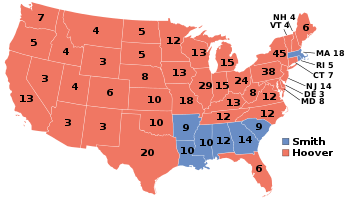
Minnesota was won by the Republican candidate, Secretary of Commerce Herbert Hoover won the state over New York governor Al Smith by a margin of 164,526 votes, or 16.94%. Nationally, Hoover won the election, with 444 electoral votes and a landslide 17.41% lead over Smith in the popular vote.
This would be the final time a Republican would win Minnesota in a presidential election until Dwight D. Eisenhower won it in 1952. This was also the last presidential election held in Minnesota before the elimination of the 10th congressional district, and hence the last presidential election in which Minnesota had 12 electoral votes. As of the 2016 presidential election, this is the last election in which Carlton County and St. Louis County voted for a Republican presidential candidate.[1]
Results
| 1928 United States presidential election in Minnesota[2] | |||||
|---|---|---|---|---|---|
| Party | Candidate | Votes | Percentage | Electoral votes | |
| Republican | Herbert Hoover | 560,977 | 57.77% | 12 | |
| Democratic | Al Smith | 396,451 | 40.83% | 0 | |
| Socialist | Norman Thomas | 6,774 | 0.70% | 0 | |
| Workers (Communist) | William Z. Foster | 4,853 | 0.50% | 0 | |
| Socialist Labor | Verne L. Reynolds | 1,921 | 0.20% | 0 | |
| Totals | 970,976 | 100.00% | 12 | ||
Results by county
| Herbert Clark Hoover Republican |
Alfred Emmanuel Smith Democratic |
Various candidates Other parties |
Margin | Total votes cast[lower-alpha 1][3] | |||||
|---|---|---|---|---|---|---|---|---|---|
| County | # | % | # | % | # | % | # | % | # |
| Aitkin | 3,951 | 70.10% | 1,428 | 25.34% | 257 | 4.56% | 2,523 | 44.77% | 5,636 |
| Anoka | 3,816 | 59.05% | 2,571 | 39.79% | 75 | 1.16% | 1,245 | 19.27% | 6,462 |
| Becker | 4,273 | 55.47% | 3,253 | 42.23% | 177 | 2.30% | 1,020 | 13.24% | 7,703 |
| Beltrami | 4,062 | 62.28% | 2,221 | 34.05% | 239 | 3.66% | 1,841 | 28.23% | 6,522 |
| Benton | 2,373 | 46.29% | 2,732 | 53.30% | 21 | 0.41% | -359 | -7.00% | 5,126 |
| Big Stone | 1,641 | 43.20% | 2,133 | 56.15% | 25 | 0.66% | -492 | -12.95% | 3,799 |
| Blue Earth | 8,120 | 60.71% | 5,177 | 38.70% | 79 | 0.59% | 2,943 | 22.00% | 13,376 |
| Brown | 3,611 | 40.05% | 5,341 | 59.24% | 64 | 0.71% | -1,730 | -19.19% | 9,016 |
| Carlton | 4,582 | 64.01% | 2,138 | 29.87% | 438 | 6.12% | 2,444 | 34.14% | 7,158 |
| Carver | 3,983 | 57.72% | 2,885 | 41.81% | 33 | 0.48% | 1,098 | 15.91% | 6,901 |
| Cass | 3,781 | 67.02% | 1,747 | 30.96% | 114 | 2.02% | 2,034 | 36.05% | 5,642 |
| Chippewa | 3,547 | 62.77% | 2,032 | 35.96% | 72 | 1.27% | 1,515 | 26.81% | 5,651 |
| Chisago | 4,215 | 75.51% | 1,297 | 23.24% | 70 | 1.25% | 2,918 | 52.28% | 5,582 |
| Clay | 5,057 | 61.13% | 3,128 | 37.81% | 87 | 1.05% | 1,929 | 23.32% | 8,272 |
| Clearwater | 1,898 | 60.01% | 1,189 | 37.59% | 76 | 2.40% | 709 | 22.42% | 3,163 |
| Cook | 609 | 72.59% | 219 | 26.10% | 11 | 1.31% | 390 | 46.48% | 839 |
| Cottonwood | 3,405 | 67.45% | 1,604 | 31.77% | 39 | 0.77% | 1,801 | 35.68% | 5,048 |
| Crow Wing | 6,436 | 67.87% | 2,851 | 30.06% | 196 | 2.07% | 3,585 | 37.80% | 9,483 |
| Dakota | 6,019 | 45.18% | 7,215 | 54.15% | 89 | 0.67% | -1,196 | -8.98% | 13,323 |
| Dodge | 3,569 | 74.49% | 1,196 | 24.96% | 26 | 0.54% | 2,373 | 49.53% | 4,791 |
| Douglas | 4,262 | 59.27% | 2,829 | 39.34% | 100 | 1.39% | 1,433 | 19.93% | 7,191 |
| Faribault | 5,885 | 69.21% | 2,542 | 29.90% | 76 | 0.89% | 3,343 | 39.32% | 8,503 |
| Fillmore | 7,719 | 77.77% | 2,143 | 21.59% | 63 | 0.63% | 5,576 | 56.18% | 9,925 |
| Freeborn | 7,815 | 72.70% | 2,859 | 26.60% | 76 | 0.71% | 4,956 | 46.10% | 10,750 |
| Goodhue | 9,752 | 72.93% | 3,520 | 26.32% | 100 | 0.75% | 6,232 | 46.60% | 13,372 |
| Grant | 2,057 | 54.33% | 1,687 | 44.56% | 42 | 1.11% | 370 | 9.77% | 3,786 |
| Hennepin | 125,472 | 60.19% | 80,851 | 38.79% | 2,124 | 1.02% | 44,621 | 21.41% | 208,447 |
| Houston | 3,615 | 64.87% | 1,937 | 34.76% | 21 | 0.38% | 1,678 | 30.11% | 5,573 |
| Hubbard | 2,291 | 65.76% | 1,120 | 32.15% | 73 | 2.10% | 1,171 | 33.61% | 3,484 |
| Isanti | 3,137 | 71.13% | 1,191 | 27.01% | 82 | 1.86% | 1,946 | 44.13% | 4,410 |
| Itasca | 5,103 | 58.95% | 3,122 | 36.07% | 431 | 4.98% | 1,981 | 22.89% | 8,656 |
| Jackson | 3,099 | 55.06% | 2,503 | 44.47% | 26 | 0.46% | 596 | 10.59% | 5,628 |
| Kanabec | 2,380 | 68.35% | 1,040 | 29.87% | 62 | 1.78% | 1,340 | 38.48% | 3,482 |
| Kandiyohi | 5,780 | 67.82% | 2,481 | 29.11% | 261 | 3.06% | 3,299 | 38.71% | 8,522 |
| Kittson | 1,957 | 56.81% | 1,383 | 40.15% | 105 | 3.05% | 574 | 16.66% | 3,445 |
| Koochiching | 2,599 | 53.67% | 2,110 | 43.57% | 134 | 2.77% | 489 | 10.10% | 4,843 |
| Lac qui Parle | 3,406 | 59.65% | 2,245 | 39.32% | 59 | 1.03% | 1,161 | 20.33% | 5,710 |
| Lake | 2,014 | 72.84% | 618 | 22.35% | 133 | 4.81% | 1,396 | 50.49% | 2,765 |
| Lake of the Woods | 781 | 51.45% | 681 | 44.86% | 56 | 3.69% | 100 | 6.59% | 1,518 |
| Le Sueur | 3,401 | 42.23% | 4,615 | 57.30% | 38 | 0.47% | -1,214 | -15.07% | 8,054 |
| Lincoln | 1,952 | 48.20% | 2,064 | 50.96% | 34 | 0.84% | -112 | -2.77% | 4,050 |
| Lyon | 4,058 | 54.93% | 3,274 | 44.32% | 56 | 0.76% | 784 | 10.61% | 7,388 |
| McLeod | 4,252 | 54.82% | 3,445 | 44.41% | 60 | 0.77% | 807 | 10.40% | 7,757 |
| Mahnomen | 606 | 29.90% | 1,378 | 67.98% | 43 | 2.12% | -772 | -38.09% | 2,027 |
| Marshall | 3,738 | 61.58% | 2,200 | 36.24% | 132 | 2.17% | 1,538 | 25.34% | 6,070 |
| Martin | 5,110 | 64.10% | 2,822 | 35.40% | 40 | 0.50% | 2,288 | 28.70% | 7,972 |
| Meeker | 4,175 | 59.63% | 2,761 | 39.43% | 66 | 0.94% | 1,414 | 20.19% | 7,002 |
| Mille Lacs | 3,998 | 72.01% | 1,436 | 25.86% | 118 | 2.13% | 2,562 | 46.15% | 5,552 |
| Morrison | 3,846 | 42.18% | 5,222 | 57.27% | 51 | 0.56% | -1,376 | -15.09% | 9,119 |
| Mower | 6,209 | 63.09% | 3,587 | 36.45% | 46 | 0.47% | 2,622 | 26.64% | 9,842 |
| Murray | 2,602 | 55.26% | 2,078 | 44.13% | 29 | 0.62% | 524 | 11.13% | 4,709 |
| Nicollet | 3,628 | 59.13% | 2,466 | 40.19% | 42 | 0.68% | 1,162 | 18.94% | 6,136 |
| Nobles | 3,676 | 56.01% | 2,862 | 43.61% | 25 | 0.38% | 814 | 12.40% | 6,563 |
| Norman | 3,308 | 67.39% | 1,401 | 28.54% | 200 | 4.07% | 1,907 | 38.85% | 4,909 |
| Olmsted | 8,334 | 63.63% | 4,720 | 36.04% | 44 | 0.34% | 3,614 | 27.59% | 13,098 |
| Otter Tail | 11,624 | 68.28% | 4,990 | 29.31% | 411 | 2.41% | 6,634 | 38.97% | 17,025 |
| Pennington | 2,506 | 65.29% | 1,198 | 31.21% | 134 | 3.49% | 1,308 | 34.08% | 3,838 |
| Pine | 4,278 | 56.53% | 3,185 | 42.09% | 105 | 1.39% | 1,093 | 14.44% | 7,568 |
| Pipestone | 2,578 | 61.40% | 1,591 | 37.89% | 30 | 0.71% | 987 | 23.51% | 4,199 |
| Polk | 7,215 | 56.08% | 5,357 | 41.64% | 294 | 2.29% | 1,858 | 14.44% | 12,866 |
| Pope | 3,382 | 66.13% | 1,667 | 32.60% | 65 | 1.27% | 1,715 | 33.54% | 5,114 |
| Ramsey | 53,054 | 47.84% | 56,807 | 51.22% | 1,049 | 0.95% | -3,753 | -3.38% | 110,910 |
| Red Lake | 712 | 31.56% | 1,507 | 66.80% | 37 | 1.64% | -795 | -35.24% | 2,256 |
| Redwood | 5,111 | 63.18% | 2,899 | 35.84% | 79 | 0.98% | 2,212 | 27.35% | 8,089 |
| Renville | 5,107 | 57.18% | 3,731 | 41.77% | 94 | 1.05% | 1,376 | 15.41% | 8,932 |
| Rice | 6,576 | 56.50% | 5,014 | 43.08% | 49 | 0.42% | 1,562 | 13.42% | 11,639 |
| Rock | 2,433 | 60.03% | 1,607 | 39.65% | 13 | 0.32% | 826 | 20.38% | 4,053 |
| Roseau | 2,618 | 63.16% | 1,342 | 32.38% | 185 | 4.46% | 1,276 | 30.78% | 4,145 |
| Saint Louis | 44,331 | 61.13% | 25,401 | 35.03% | 2,785 | 3.84% | 18,930 | 26.10% | 72,517 |
| Scott | 1,732 | 28.11% | 4,419 | 71.71% | 11 | 0.18% | -2,687 | -43.61% | 6,162 |
| Sherburne | 2,437 | 69.08% | 1,064 | 30.16% | 27 | 0.77% | 1,373 | 38.92% | 3,528 |
| Sibley | 3,301 | 55.94% | 2,553 | 43.26% | 47 | 0.80% | 748 | 12.68% | 5,901 |
| Stearns | 6,459 | 28.56% | 16,104 | 71.21% | 52 | 0.23% | -9,645 | -42.65% | 22,615 |
| Steele | 4,744 | 62.46% | 2,826 | 37.21% | 25 | 0.33% | 1,918 | 25.25% | 7,595 |
| Stevens | 2,275 | 60.70% | 1,457 | 38.87% | 16 | 0.43% | 818 | 21.82% | 3,748 |
| Swift | 2,791 | 49.72% | 2,733 | 48.69% | 89 | 1.59% | 58 | 1.03% | 5,613 |
| Todd | 5,682 | 59.81% | 3,733 | 39.29% | 85 | 0.89% | 1,949 | 20.52% | 9,500 |
| Traverse | 1,214 | 38.79% | 1,899 | 60.67% | 17 | 0.54% | -685 | -21.88% | 3,130 |
| Wabasha | 3,944 | 55.84% | 3,087 | 43.71% | 32 | 0.45% | 857 | 12.13% | 7,063 |
| Wadena | 2,592 | 64.09% | 1,343 | 33.21% | 109 | 2.70% | 1,249 | 30.89% | 4,044 |
| Waseca | 3,251 | 56.94% | 2,418 | 42.35% | 41 | 0.72% | 833 | 14.59% | 5,710 |
| Washington | 6,113 | 59.06% | 4,158 | 40.17% | 80 | 0.77% | 1,955 | 18.89% | 10,351 |
| Watonwan | 3,306 | 69.69% | 1,412 | 29.76% | 26 | 0.55% | 1,894 | 39.92% | 4,744 |
| Wilkin | 1,874 | 53.90% | 1,578 | 45.38% | 25 | 0.72% | 296 | 8.51% | 3,477 |
| Winona | 7,459 | 53.16% | 6,484 | 46.21% | 88 | 0.63% | 975 | 6.95% | 14,031 |
| Wright | 6,011 | 56.57% | 4,483 | 42.19% | 132 | 1.24% | 1,528 | 14.38% | 10,626 |
| Yellow Medicine | 3,302 | 52.56% | 2,861 | 45.54% | 119 | 1.89% | 441 | 7.02% | 6,282 |
| Totals | 560,977 | 57.77% | 396,458 | 40.83% | 13,587 | 1.40% | 164,519 | 16.94% | 971,022 |
Notes
- Some of these figures differ from those at Dave Leip’s Atlas.
References
- Sullivan, Robert David; ‘How the Red and Blue Map Evolved Over the Past Century’; America Magazine in The National Catholic Review; June 29, 2016
- "1928 Presidential Election Results, 1928". Dave Leip's U.S. Election Atlas. Retrieved 2016-10-05.
- Robinson, Edgar Eugene; The Presidential Vote 1896-1932, pp. 234-241 ISBN 9780804716963


