1896 United States presidential election in South Carolina
The 1896 United States presidential election in South Carolina took place on November 3, 1896. Voters chose 9 representatives, or electors to the Electoral College, who voted for president and vice president.
| ||||||||||||||||||||||||||
| ||||||||||||||||||||||||||
| ||||||||||||||||||||||||||
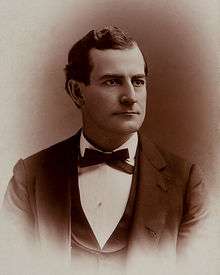
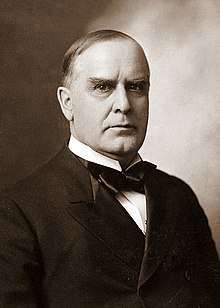

South Carolina overwhelmingly voted for the Democratic nominee, former U.S. Representative from Nebraska William Jennings Bryan, over the Republican nominee, former governor of Ohio William McKinley. Bryan won the state by a landslide margin of 71.79%.
Results
| United States presidential election in South Carolina, 1896[1] | ||||||||
|---|---|---|---|---|---|---|---|---|
| Party | Candidate | Running mate | Popular vote | Electoral vote | ||||
| Count | % | Count | % | |||||
| Democratic | William Jennings Bryan of Nebraska | Arthur Sewall of Maine | 58,801 | 85.30% | 9 | 100.00% | ||
| Republican | William McKinley of Ohio | Garret Hobart of New Jersey | 9,313 | 13.51% | 0 | 0.00% | ||
| National Democratic | John McAuley Palmer of Illinois | Simon Bolivar Buckner of Kentucky | 824 | 1.20% | 0 | 0.00% | ||
| Total | 68,938 | 100.00% | 9 | 100.00% | ||||
Results by county
| County | William Jennings Bryan Democratic |
William McKinley Republican |
John McAuley Palmer[lower-alpha 1] National Democratic |
Margin | Total votes cast[2] | ||||
|---|---|---|---|---|---|---|---|---|---|
| # | % | # | % | # | % | # | % | ||
| Abbeville | 2,473 | 92.10% | 212 | 7.90% | 2,261 | 84.21% | 2,685 | ||
| Aiken | 1,819 | 94.25% | 111 | 5.75% | 1,708 | 88.50% | 1,930 | ||
| Anderson | 3,109 | 91.01% | 307 | 8.99% | 2,802 | 82.03% | 3,416 | ||
| Barnwell | 2,385 | 93.86% | 156 | 6.14% | 2,229 | 87.72% | 2,541 | ||
| Beaufort | 289 | 43.79% | 371 | 56.21% | -82 | -12.42% | 660 | ||
| Berkeley | 513 | 76.68% | 156 | 23.32% | 357 | 53.36% | 669 | ||
| Charleston | 1,660 | 62.83% | 982 | 37.17% | 678 | 25.66% | 2,642 | ||
| Chester | 1,254 | 94.29% | 76 | 5.71% | 1,178 | 88.57% | 1,330 | ||
| Chesterfield | 1,465 | 92.72% | 115 | 7.28% | 1,350 | 85.44% | 1,580 | ||
| Clarendon | 1,450 | 90.23% | 157 | 9.77% | 1,293 | 80.46% | 1,607 | ||
| Colleton | 1,646 | 84.80% | 295 | 15.20% | 1,351 | 69.60% | 1,941 | ||
| Darlington | 1,625 | 91.70% | 147 | 8.30% | 1,478 | 83.41% | 1,772 | ||
| Edgefield | 1,532 | 88.97% | 190 | 11.03% | 1,342 | 77.93% | 1,722 | ||
| Fairfield | 1,078 | 96.16% | 43 | 3.84% | 1,035 | 92.33% | 1,121 | ||
| Florence | 1,530 | 94.80% | 84 | 5.20% | 1,446 | 89.59% | 1,614 | ||
| Georgetown | 459 | 39.50% | 703 | 60.50% | -244 | -21.00% | 1,162 | ||
| Greenville | 2,718 | 92.70% | 214 | 7.30% | 2,504 | 85.40% | 2,932 | ||
| Hampton | 1,072 | 97.72% | 25 | 2.28% | 1,047 | 95.44% | 1,097 | ||
| Horry | 1,372 | 87.50% | 196 | 12.50% | 1,176 | 75.00% | 1,568 | ||
| Kershaw | 1,191 | 90.16% | 130 | 9.84% | 1,061 | 80.32% | 1,321 | ||
| Lancaster | 1,557 | 89.79% | 177 | 10.21% | 1,380 | 79.58% | 1,734 | ||
| Laurens | 1,943 | 94.78% | 107 | 5.22% | 1,836 | 89.56% | 2,050 | ||
| Lexington | 1,672 | 89.46% | 197 | 10.54% | 1,475 | 78.92% | 1,869 | ||
| Marion | 1,936 | 86.08% | 313 | 13.92% | 1,623 | 72.17% | 2,249 | ||
| Marlboro | 1,232 | 88.25% | 164 | 11.75% | 1,068 | 76.50% | 1,396 | ||
| Newberry | 1,525 | 97.76% | 35 | 2.24% | 1,490 | 95.51% | 1,560 | ||
| Oconee | 1,392 | 93.05% | 104 | 6.95% | 1,288 | 86.10% | 1,496 | ||
| Orangeburg | 2,729 | 93.08% | 203 | 6.92% | 2,526 | 86.15% | 2,932 | ||
| Pickens | 1,261 | 90.14% | 138 | 9.86% | 1,123 | 80.27% | 1,399 | ||
| Richland | 925 | 71.26% | 373 | 28.74% | 552 | 42.53% | 1,298 | ||
| Saluda | 1,241 | 96.50% | 45 | 3.50% | 1,196 | 93.00% | 1,286 | ||
| Spartanburg | 4,234 | 96.93% | 134 | 3.07% | 4,100 | 93.86% | 4,368 | ||
| Sumter | 1,550 | 88.47% | 202 | 11.53% | 1,348 | 76.94% | 1,752 | ||
| Union | 1,379 | 92.43% | 113 | 7.57% | 1,266 | 84.85% | 1,492 | ||
| Williamsburg | 1,570 | 84.09% | 297 | 15.91% | 1,273 | 68.18% | 1,867 | ||
| York | 2,013 | 92.98% | 152 | 7.02% | 1,861 | 85.96% | 2,165 | ||
| Totals | 58,799 | 87.70% | 7,424 | 11.07% | 824 | 1.23% | 51,375 | 76.63% | 67,047 |
Notes
- The National (Gold) Democratic ticket vote was listed as a state-wide total and not by counties.
References
- "1896 Presidential General Election Results - South Carolina". U.S. Election Atlas. Retrieved 23 December 2013.
- Robinson, Edgar Eugene; The Presidential Vote 1896-1932, pp. 314-317 ISBN 9780804716963
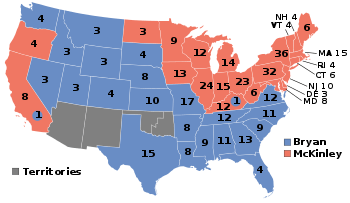
State and district results of the 1896 United States presidential election | ||
|---|---|---|
|  | |
This article is issued from Wikipedia. The text is licensed under Creative Commons - Attribution - Sharealike. Additional terms may apply for the media files.