1976 United States presidential election in Florida
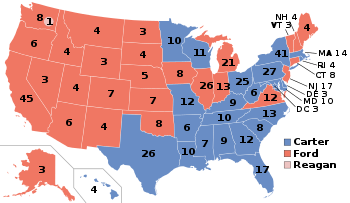
In the 1976 United States presidential election, Florida was won by the Democratic candidate, former Governor of Georgia Jimmy Carter, over the Republican candidate, incumbent President Gerald Ford. Carter won by a margin of 5.29%, giving him 17 electoral votes. Other Southern states also went for Carter, especially his home state of Georgia and Arkansas.[1]
| ||||||||||||||||||||||||||
| Turnout | ||||||||||||||||||||||||||
|---|---|---|---|---|---|---|---|---|---|---|---|---|---|---|---|---|---|---|---|---|---|---|---|---|---|---|
| ||||||||||||||||||||||||||
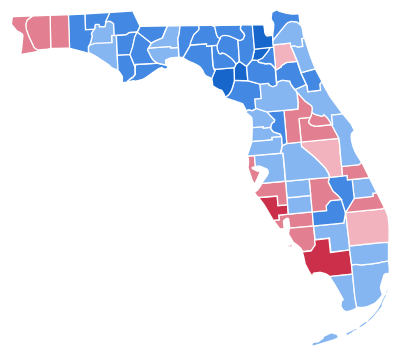 County results
| ||||||||||||||||||||||||||
| ||||||||||||||||||||||||||
.jpg)
| Elections in Florida | ||||||||||||||
|---|---|---|---|---|---|---|---|---|---|---|---|---|---|---|
 | ||||||||||||||
|
||||||||||||||
|
||||||||||||||
|
|
||||||||||||||
|
North Miami
|
||||||||||||||
|
||||||||||||||
|
|
||||||||||||||
|
| ||||||||||||||
A bellwether state today, Florida has voted for the winner in every election since 1928, except for two elections (1960 and later 1992). As of the 2016 presidential election, this is the last election in which Duval County, Polk County, Brevard County, Marion County, Bay County, Holmes County, Washington County, DeSoto County, Hardee County, Nassau County, St. Johns County, and Walton County voted for a Democratic presidential candidate. [2] As of the 2016 presidential election, this is the last time Florida voted more Democratic than the national average.
Results
| Presidential candidate | Party | Home state | Popular vote | Electoral vote |
Running mate | |||
|---|---|---|---|---|---|---|---|---|
| Count | Percentage | Vice-presidential candidate | Home state | Electoral vote | ||||
| Jimmy Carter | Democratic | Georgia | 1,636,000 | 51.93% | 17 | Walter Mondale | Minnesota | 17 |
| Gerald Ford | Republican | Michigan | 1,469,531 | 46.64% | 0 | Bob Dole | Kansas | 0 |
| Eugene McCarthy | Independent | Minnesota | 23,643 | 0.75% | 0 | Sharon Stone Kilpatrick | Virginia | 0 |
| Thomas J. Anderson | American | Tennessee | 21,325 | 0.68% | 0 | Rufus Shackelford | Florida | 0 |
| Roger MacBride | Libertarian | Virginia | 103 | 0.00% | 0 | David Bergland | California | 0 |
| Julius Levin | Socialist Labor | New Jersey | 19 | 0.00% | 0 | Constance Blomen | Massachusetts | 0 |
| Frank Zeidler | Socialist | Wisconsin | 8 | 0.00% | 0 | J. Quinn Brisben | Illinois | 0 |
| Ernest Miller | Write-in | — | 2 | 0.00% | 0 | — | — | 0 |
| Total | 3,150,631 | 100% | 17 | 17 | ||||
| Needed to win | 270 | 270 | ||||||
Results by county
| James Earl Carter Democratic |
Gerald Rudolph Ford Republican |
Various candidates Other parties |
Margin | Total votes cast | |||||
|---|---|---|---|---|---|---|---|---|---|
| County | # | % | # | % | # | % | # | % | # |
| Alachua | 27,895 | 62.58% | 15,546 | 34.87% | 1,137 | 2.55% | 12,349 | 27.70% | 44,578 |
| Baker | 2,985 | 71.16% | 1,058 | 25.22% | 152 | 3.62% | 1,927 | 45.94% | 4,195 |
| Bay | 14,858 | 50.39% | 14,208 | 48.19% | 418 | 1.42% | 650 | 2.20% | 29,484 |
| Bradford | 3,868 | 68.86% | 1,680 | 29.91% | 69 | 1.23% | 2,188 | 38.95% | 5,617 |
| Brevard | 46,421 | 50.26% | 44,470 | 48.15% | 1,473 | 1.59% | 1,951 | 2.11% | 92,364 |
| Broward | 176,491 | 51.55% | 161,411 | 47.15% | 4,441 | 1.30% | 15,080 | 4.40% | 342,343 |
| Calhoun | 2,487 | 67.42% | 1,153 | 31.26% | 49 | 1.33% | 1,334 | 36.16% | 3,689 |
| Charlotte | 10,300 | 44.14% | 12,703 | 54.44% | 330 | 1.41% | -2,403 | -10.30% | 23,333 |
| Citrus | 9,438 | 53.30% | 7,973 | 45.03% | 296 | 1.67% | 1,465 | 8.27% | 17,707 |
| Clay | 8,410 | 49.04% | 8,468 | 49.38% | 270 | 1.57% | -58 | -0.34% | 17,148 |
| Collier | 8,764 | 36.96% | 14,643 | 61.76% | 303 | 1.28% | -5,879 | -24.80% | 23,710 |
| Columbia | 6,683 | 62.08% | 3,947 | 36.66% | 136 | 1.26% | 2,736 | 25.41% | 10,766 |
| Dade | 303,047 | 58.06% | 211,148 | 40.45% | 7,747 | 1.48% | 91,899 | 17.61% | 521,942 |
| Desoto | 2,715 | 56.30% | 2,000 | 41.48% | 107 | 2.22% | 715 | 14.83% | 4,822 |
| Dixie | 2,169 | 78.82% | 558 | 20.28% | 25 | 0.91% | 1,611 | 58.54% | 2,752 |
| Duval | 105,912 | 58.01% | 74,997 | 41.08% | 1,652 | 0.90% | 30,915 | 16.93% | 182,561 |
| Escambia | 38,279 | 47.42% | 41,471 | 51.38% | 965 | 1.20% | -3,192 | -3.95% | 80,715 |
| Flagler | 2,086 | 61.84% | 1,262 | 37.41% | 25 | 0.74% | 824 | 24.43% | 3,373 |
| Franklin | 1,859 | 62.53% | 1,054 | 35.45% | 60 | 2.02% | 805 | 27.08% | 2,973 |
| Gadsden | 6,798 | 65.17% | 3,531 | 33.85% | 102 | 0.98% | 3,267 | 31.32% | 10,431 |
| Gilchrist | 1,807 | 76.76% | 528 | 22.43% | 19 | 0.81% | 1,279 | 54.33% | 2,354 |
| Glades | 1,311 | 66.72% | 624 | 31.76% | 30 | 1.53% | 687 | 34.96% | 1,965 |
| Gulf | 2,641 | 61.69% | 1,584 | 37.00% | 56 | 1.31% | 1,057 | 24.69% | 4,281 |
| Hamilton | 2,053 | 69.57% | 794 | 26.91% | 104 | 3.52% | 1,259 | 42.66% | 2,951 |
| Hardee | 2,670 | 52.28% | 2,189 | 42.86% | 248 | 4.86% | 481 | 9.42% | 5,107 |
| Hendry | 2,337 | 54.94% | 1,843 | 43.32% | 74 | 1.74% | 494 | 11.61% | 4,254 |
| Hernando | 7,717 | 56.20% | 5,793 | 42.19% | 222 | 1.62% | 1,924 | 14.01% | 13,732 |
| Highlands | 7,218 | 45.88% | 8,317 | 52.86% | 198 | 1.26% | -1,099 | -6.99% | 15,733 |
| Hillsborough | 94,589 | 54.01% | 78,504 | 44.82% | 2,052 | 1.17% | 16,085 | 9.18% | 175,145 |
| Holmes | 3,256 | 62.86% | 1,850 | 35.71% | 74 | 1.43% | 1,406 | 27.14% | 5,180 |
| Indian River | 8,512 | 45.63% | 9,818 | 52.63% | 324 | 1.74% | -1,306 | -7.00% | 18,654 |
| Jackson | 7,687 | 60.76% | 4,795 | 37.90% | 170 | 1.34% | 2,892 | 22.86% | 12,652 |
| Jefferson | 2,310 | 61.62% | 1,361 | 36.30% | 78 | 2.08% | 949 | 25.31% | 3,749 |
| Lafayette | 1,126 | 67.63% | 523 | 31.41% | 16 | 0.96% | 603 | 36.22% | 1,665 |
| Lake | 14,369 | 41.31% | 19,976 | 57.42% | 442 | 1.27% | -5,607 | -16.12% | 34,787 |
| Lee | 30,567 | 43.80% | 38,038 | 54.50% | 1,184 | 1.70% | -7,471 | -10.71% | 69,789 |
| Leon | 28,729 | 53.76% | 23,739 | 44.42% | 975 | 1.82% | 4,990 | 9.34% | 53,443 |
| Levy | 4,025 | 65.28% | 1,965 | 31.87% | 176 | 2.85% | 2,060 | 33.41% | 6,166 |
| Liberty | 1,137 | 64.02% | 620 | 34.91% | 19 | 1.07% | 517 | 29.11% | 1,776 |
| Madison | 3,218 | 63.85% | 1,761 | 34.94% | 61 | 1.21% | 1,457 | 28.91% | 5,040 |
| Manatee | 24,342 | 44.78% | 29,300 | 53.90% | 718 | 1.32% | -4,958 | -9.12% | 54,360 |
| Marion | 16,963 | 50.37% | 16,163 | 47.99% | 553 | 1.64% | 800 | 2.38% | 33,679 |
| Martin | 8,785 | 42.33% | 11,682 | 56.28% | 289 | 1.39% | -2,897 | -13.96% | 20,756 |
| Monroe | 11,079 | 56.08% | 8,232 | 41.67% | 446 | 2.26% | 2,847 | 14.41% | 19,757 |
| Nassau | 5,896 | 64.51% | 3,136 | 34.31% | 108 | 1.18% | 2,760 | 30.20% | 9,140 |
| Okaloosa | 14,210 | 42.68% | 18,598 | 55.86% | 487 | 1.46% | -4,388 | -13.18% | 33,295 |
| Okeechobee | 3,184 | 65.99% | 1,598 | 33.12% | 43 | 0.89% | 1,586 | 32.87% | 4,825 |
| Orange | 58,442 | 44.80% | 70,451 | 54.01% | 1,544 | 1.18% | -12,009 | -9.21% | 130,437 |
| Osceola | 6,893 | 48.63% | 7,062 | 49.82% | 220 | 1.55% | -169 | -1.19% | 14,175 |
| Palm Beach | 96,705 | 48.68% | 98,236 | 49.45% | 3,716 | 1.87% | -1,531 | -0.77% | 198,657 |
| Pasco | 33,710 | 53.72% | 28,306 | 45.11% | 731 | 1.16% | 5,404 | 8.61% | 62,747 |
| Pinellas | 141,879 | 48.00% | 150,003 | 50.75% | 3,687 | 1.25% | -8,124 | -2.75% | 295,569 |
| Polk | 47,286 | 51.01% | 44,238 | 47.72% | 1,182 | 1.27% | 3,048 | 3.29% | 92,706 |
| Putnam | 9,597 | 64.81% | 5,040 | 34.03% | 172 | 1.16% | 4,557 | 30.77% | 14,809 |
| St. Johns | 7,412 | 51.58% | 6,660 | 46.34% | 299 | 2.08% | 752 | 5.23% | 14,371 |
| St. Lucie | 12,386 | 51.16% | 11,502 | 47.51% | 321 | 1.33% | 884 | 3.65% | 24,209 |
| Santa Rosa | 8,020 | 46.06% | 9,122 | 52.39% | 270 | 1.55% | -1,102 | -6.33% | 17,412 |
| Sarasota | 26,293 | 36.78% | 44,157 | 61.78% | 1,028 | 1.44% | -17,864 | -24.99% | 71,478 |
| Seminole | 19,609 | 41.89% | 26,655 | 56.94% | 549 | 1.17% | -7,046 | -15.05% | 46,813 |
| Sumter | 4,721 | 66.59% | 2,212 | 31.20% | 157 | 2.21% | 2,509 | 35.39% | 7,090 |
| Suwannee | 4,718 | 63.74% | 2,405 | 32.49% | 279 | 3.77% | 2,313 | 31.25% | 7,402 |
| Taylor | 3,370 | 62.34% | 1,983 | 36.68% | 53 | 0.98% | 1,387 | 25.66% | 5,406 |
| Union | 1,480 | 72.55% | 544 | 26.67% | 16 | 0.78% | 936 | 45.88% | 2,040 |
| Volusia | 49,161 | 55.72% | 37,523 | 42.53% | 1,541 | 1.75% | 11,638 | 13.19% | 88,225 |
| Wakulla | 2,353 | 57.78% | 1,580 | 38.80% | 139 | 3.41% | 773 | 18.98% | 4,072 |
| Walton | 5,196 | 62.76% | 2,927 | 35.35% | 156 | 1.88% | 2,269 | 27.41% | 8,279 |
| Washington | 3,566 | 59.47% | 2,313 | 38.58% | 117 | 1.95% | 1,253 | 20.90% | 5,996 |
| Totals | 1,636,000 | 51.93% | 1,469,531 | 46.64% | 45,100 | 1.43% | 166,469 | 5.28% | 3,150,631 |
References
- Dave Leip's U.S. Election Atlas; 1976 Presidential General Election Results – Florida
- Sullivan, Robert David; ‘How the Red and Blue Map Evolved Over the Past Century’; America Magazine in The National Catholic Review; June 29, 2016