The Wrekin (UK Parliament constituency)
The Wrekin is a constituency[n 1] in the House of Commons of the British Parliament, located in the county of Shropshire in the West Midlands of England. It has existed continuously since its creation by the Representation of the People Act 1918, and is named after a prominent landmark hill in the area, The Wrekin. The constituency has periodically swung back and forth between the Labour and Conservative parties since the 1920s, and has been held since 2005 by a Conservative MP, Mark Pritchard.[n 2]
| The Wrekin | |
|---|---|
| County constituency for the House of Commons | |
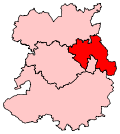
 Boundary of The Wrekin in Shropshire | |
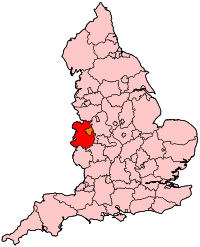
 Location of Shropshire within England | |
| County | Shropshire |
| Electorate | 66,111 (December 2010)[1] |
| Major settlements | Albrighton, Cosford, Shifnal, Wellington |
| Current constituency | |
| Created | 1918 |
| Member of Parliament | Mark Pritchard (Conservative) |
| Number of members | One |
| Created from | Wellington, Newport and Ludlow |
History
- Most prominent members in Parliament
Anthony Trafford (Conservative) went on after serving as MP to serve as a health minister, from the House of Lords in 1989.
Gerald Fowler (Labour) reached the frontbenches of government as the Minister for Education and Science from 1969 to 1970, again in 1974 and 1976 and as Minister for the Privy Council Office from 1974 to 1976.
Bruce Grocott (Labour) went on, after serving as MP for the newly created neighbouring seat from 1997 to 2001, to serve as the Government's Chief Whip in the House of Lords for six years.
- Political history
The seat saw a first winning candidate from the Labour Party relatively early in its history, in 1923. The seat alternated between the two largest modern parties eight times between 1923 and 1979.
In more recent history, reflecting the growing population of Telford and the rich iron smelting, railway and mining industries as major historic employers in the area, the seat was more Labour-leaning than the national average but still marginal, being represented by a Conservative for the first eight years of the Thatcher ministry and then (from 1987) returning a Labour member, who went on to serve a new seat created to serve Telford in 1997, and another Labour member until 2005, followed by the present Conservative who was elected that year. The present majority is over 9,000 votes.
Boundaries
1918–1950: The Borough of Wenlock, the Urban Districts of Dawley, Newport, Oakengates, and Wellington, and the Rural Districts of Newport, and Shifnal and Wellington.
1950–1983: The Urban Districts of Dawley, Newport, Oakengates, and Wellington, and the Rural Districts of Shifnal and Wellington.
1983–1997: The District of The Wrekin wards of Arleston, Brookside, College, Cuckoo Oak, Dawley Magna, Donnington, Donnington Wood, Dothill, Ercall, Hadley, Haygate, Hollinswood/Randlay, Ironbridge (The Gorge), Ketley, Ketley Bank, Langley, Lawley, Leegomery, Lilleshall, Madeley, Malinslee, Park, Priorslee, Stirchley, Wombridge, Woodside, Wrockwardine, and Wrockwardine Wood.
1997–2010: The District of The Wrekin wards of Arleston, Church Aston, College, Donnington, Donnington Wood, Dothill and Park, Edgmond, Ercall, Ercall Magna, Hadley, Haygate, Ketley, Leegomery, Lilleshall, Newport East, Newport North, Newport West, and Wrockwardine, and the District of Bridgnorth wards of Albrighton, Idsall, Manor, and Sheriffhales.
2010–present: The Borough of Telford and Wrekin wards of Apley Castle, Arleston, Church Aston and Lilleshall, College, Donnington, Dothill, Edgmond, Ercall, Ercall Magna, Hadley and Leegomery, Haygate, Muxton, Newport East, Newport North, Newport South, Newport West, Park, Shawbirch, and Wrockwardine, and the District of Bridgnorth wards of Albrighton South, Donington and Albrighton North, Shifnal Idsall, Shifnal Manor, and Shifnal Rural.
When originally constituted, the constituency, with a population of 71,352, was the largest division of Shropshire created in the 1918 boundary changes.[2]
In the Third Periodical Review of the Boundary Commission, which took effect for the 1983 general election, the constituency was redefined after major local government changes. This redefinition resulted in a quarter of the electorate being removed to Shropshire North and Ludlow.[3]
Parliament approved major boundary changes which took effect at the 1997 general election, which created a new constituency containing and named after the town of Telford, before which Telford had been one of the largest elements of The Wrekin. The new Telford constituency took 62.9% of the electorate of The Wrekin leaving the remaining 37.1% to constitute a revised constituency of The Wrekin that incorporated areas previously within Shropshire North and Ludlow from two sides.[4]
The area almost encircles Telford, a 'New Town', encompassing much of the rural parts of the Telford and Wrekin borough, in which most of the constituency is. Its major settlements include: Wellington, Newport and Shifnal, as well as the suburban northern reaches of Telford (including Donnington). A small but significant area relates to the former Bridgnorth local government district (now part of the unitary Shropshire) and contains RAF Cosford and a number of commuter villages along the M54 motorway: the civil parishes of Sheriffhales, Shifnal, Tong, Boscobel, Albrighton, Donington and Boningale make up the non-Telford and The Wrekin-administered portion. Boundary changes to realign the constituency boundaries to fit with the borough's most recent ward revisions resulted in the removal of Ketley (to the constituency of Telford) for the 2010 general election.[5]
Future proposals: Under constituency boundary proposals announced in September 2016, ahead of the next general election, this constituency is proposed to lose the Donnington and Hadley and Leegomery wards to Telford constituency, while the remainder will be merged into a new seat called Bridgnorth, Wellington and the Wrekin.[6]
Constituency profile
The constituency is in the east of Shropshire, specifically, around The Wrekin hill and therefore in undulating country within fast road access (and some rail access) commuter's reach to the West Midlands, Stafford and Stoke on Trent.
Workless claimants, registered jobseekers, were in November 2012 lower than the national average of 3.8%, at 3.1% of the population based on a statistical compilation by The Guardian.[7]
Members of Parliament
| Year | Member[8] | Whip | Notes | |
|---|---|---|---|---|
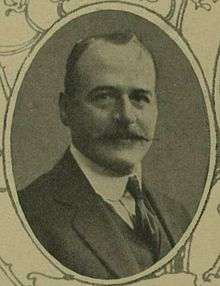
| 1918 | Sir Charles Henry | Coalition Liberal | MP for Wellington to 1918 | |
| 1920 | Charles Palmer | Independent Unionist | ||
| 1920 | Independent Parliamentary Group | |||
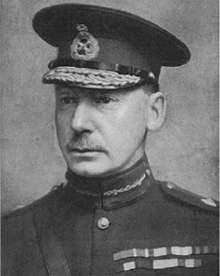
| 1920 | Sir Charles Townshend | Independent Parliamentary Group | ||
| 1922 | Howard Stransom Button | Unionist | ||
| 1923 | Henry Nixon | Labour | ||
| 1924 | Thomas Oakley | Unionist | ||
| 1929 | Edith Picton-Turbervill | Labour | ||
| 1931 | James Baldwin-Webb | Conservative | ||
| 1941 | Arthur Colegate | Conservative | MP for Burton 1950-55 | |
| 1945 | Ivor Owen Thomas | Labour | ||
| 1955 | William Yates | Conservative | ||
| 1966 | Gerald Fowler | Labour | ||
| 1970 | Anthony Trafford | Conservative | ||
| 1974 | Gerald Fowler | Labour | ||
| 1979 | Warren Hawksley | Conservative | MP for Halesowen and Stourbridge 1992-97 | |
| 1987 | Bruce Grocott | Labour | MP for Telford 1997–2001 | |
| 1997 | Peter Bradley | Labour | ||
| 2005 | Mark Pritchard | Conservative | ||
Elections
Elections in the 2010s
| Party | Candidate | Votes | % | ± | |
|---|---|---|---|---|---|
| Conservative | Mark Pritchard | 31,029 | 63.5 | +8.1 | |
| Labour | Dylan Harrison | 12,303 | 25.2 | –11.1 | |
| Liberal Democrats | Thomas Janke | 4,067 | 8.3 | +5.6 | |
| Green | Tim Dawes | 1,491 | 3.0 | +1.4 | |
| Majority | 18,726 | 38.3 | +19.0 | ||
| Turnout | 48,890 | 69.2 | –3.0 | ||
| Conservative hold | Swing | +9.5 | |||
| Party | Candidate | Votes | % | ± | |
|---|---|---|---|---|---|
| Conservative | Mark Pritchard | 27,451 | 55.4 | ||
| Labour | Dylan Harrison | 17,887 | 36.1 | ||
| UKIP | Denis Allen | 1,656 | 3.3 | ||
| Liberal Democrats | Rod Keyes | 1,345 | 2.7 | ||
| Green | Pat McCarthy | 804 | 1.6 | ||
| Independent | Fay Easton | 380 | 0.8 | ||
| Majority | 9,564 | 19.3 | |||
| Turnout | 49,523 | 72.2 | |||
| Conservative hold | Swing | ||||
| Party | Candidate | Votes | % | ± | |
|---|---|---|---|---|---|
| Conservative | Mark Pritchard | 22,579 | 49.7 | ||
| Labour | Katrina Gilman | 11,836 | 26.0 | ||
| UKIP | Jill Seymour | 7,620 | 16.8 | ||
| Liberal Democrats | Rod Keyes | 1,959 | 4.3 | ||
| Green | Cath Edwards[12] | 1,443 | 3.2 | ||
| Majority | 10,743 | 23.6 | |||
| Turnout | 45,437 | 68.9 | |||
| Conservative hold | Swing | ||||
| Party | Candidate | Votes | % | ± | |
|---|---|---|---|---|---|
| Conservative | Mark Pritchard | 21,922 | 47.7 | ||
| Labour Co-op | Paul Kalinauckas | 12,472 | 27.1 | ||
| Liberal Democrats | Alyson Cameron-Daw | 8,019 | 17.4 | ||
| UKIP | Malcolm Hurst | 2,050 | 4.5 | ||
| BNP | Susan Harwood | 1,505 | 3.3 | ||
| Majority | 9,450 | 20.5 | |||
| Turnout | 45,968 | 70.1 | |||
| Conservative hold | Swing | ||||
Elections in the 2000s
| Party | Candidate | Votes | % | ± | |
|---|---|---|---|---|---|
| Conservative | Mark Pritchard | 18,899 | 41.9 | ||
| Labour | Peter Bradley | 17,957 | 39.9 | ||
| Liberal Democrats | Bill Tomlinson | 6,608 | 14.7 | ||
| UKIP | Bruce Lawson | 1,590 | 3.5 | ||
| Majority | 942 | 2.0 | |||
| Turnout | 45,054 | 67.0 | |||
| Conservative gain from Labour | Swing | ||||
| Party | Candidate | Votes | % | ± | |
|---|---|---|---|---|---|
| Labour | Peter Bradley | 19,532 | 47.1 | ||
| Conservative | Jacob Rees-Mogg | 15,945 | 38.4 | ||
| Liberal Democrats | Ian Jenkins | 4,738 | 11.4 | ||
| UKIP | Denis Brookes | 1,275 | 3.1 | ||
| Majority | 3,587 | 8.7 | |||
| Turnout | 41,490 | 63.1 | |||
| Labour hold | Swing | ||||
Elections in the 1990s
| Party | Candidate | Votes | % | ± | |
|---|---|---|---|---|---|
| Labour | Peter Bradley | 21,243 | 46.9 | ||
| Conservative | Peter Bruinvels | 18,218 | 40.2 | ||
| Liberal Democrats | Ian Jenkins | 5,807 | 12.8 | ||
| Majority | 3,025 | 6.7 | |||
| Turnout | 45,268 | 76.6 | |||
| Labour gain from Conservative | Swing | ||||
Note: although The Wrekin was a Labour-held seat in the previous Parliament, boundary changes removed many Labour-leaning areas that now fall in the neighbouring seat of Telford, which Bruce Grocott decided to contest in 1997 instead of the new Wrekin seat. These changes made it notionally a Conservative seat, hence this is a gain rather than a hold.
| Party | Candidate | Votes | % | ± | |
|---|---|---|---|---|---|
| Labour | Bruce Grocott | 33,865 | 48.3 | ||
| Conservative | Elizabeth Holt | 27,217 | 38.8 | ||
| Liberal Democrats | Anthony West | 8,032 | 11.5 | ||
| Green | Robert Saunders | 1,008 | 1.4 | N/A | |
| Majority | 6,648 | 9.5 | |||
| Turnout | 70,122 | 77.1 | |||
| Labour hold | Swing | ||||
Elections in the 1980s
| Party | Candidate | Votes | % | ± | |
|---|---|---|---|---|---|
| Labour | Bruce Grocott | 27,681 | 42.8 | ||
| Conservative | Warren Hawksley | 26,225 | 40.6 | ||
| SDP | George Cook | 10,737 | 16.6 | ||
| Majority | 1,456 | 2.3 | N/A | ||
| Turnout | 64,643 | 78.3 | |||
| Labour gain from Conservative | Swing | ||||
| Party | Candidate | Votes | % | ± | |
|---|---|---|---|---|---|
| Conservative | Warren Hawksley | 22,710 | 39.0 | ||
| Labour | Bruce Grocott | 21,379 | 36.7 | ||
| SDP | Mark Biltcliffe | 14,208 | 24.4 | ||
| Majority | 1,331 | 2.3 | |||
| Turnout | 75.5 | ||||
| Conservative hold | Swing | ||||
Elections in the 1970s
| Party | Candidate | Votes | % | ± | |
|---|---|---|---|---|---|
| Conservative | Warren Hawksley | 32,672 | 45.6 | +7.8 | |
| Labour | Gerald Fowler | 31,707 | 44.2 | -4.5 | |
| Liberal | R. Yarnell | 7,331 | 10.2 | -3.3 | |
| Majority | 965 | 1.4 | N/A | ||
| Turnout | 71,710 | 78.4 | +3.9 | ||
| Conservative gain from Labour | Swing | ||||
| Party | Candidate | Votes | % | ± | |
|---|---|---|---|---|---|
| Labour | Gerald Fowler | 30,385 | 48.7 | ||
| Conservative | Philip Banks | 23,547 | 37.8 | ||
| Liberal | Wally Dewsnip | 8,442 | 13.5 | ||
| Majority | 6,838 | 10.9 | |||
| Turnout | 74.5 | ||||
| Labour hold | Swing | ||||
| Party | Candidate | Votes | % | ± | |
|---|---|---|---|---|---|
| Labour | Gerald Fowler | 30,642 | 46.3 | ||
| Conservative | Anthony Trafford | 24,121 | 36.4 | ||
| Liberal | Ian George Powney | 11,487 | 17.3 | ||
| Majority | 6,521 | 9.9 | |||
| Turnout | 80.8 | ||||
| Labour gain from Conservative | Swing | ||||
| Party | Candidate | Votes | % | ± | |
|---|---|---|---|---|---|
| Conservative | Anthony Trafford | 26,282 | 50.5 | ||
| Labour | Gerald Fowler | 25,764 | 49.5 | ||
| Majority | 518 | 1.0 | |||
| Turnout | 78.8 | ||||
| Conservative gain from Labour | Swing | ||||
Elections in the 1960s
| Party | Candidate | Votes | % | ± | |
|---|---|---|---|---|---|
| Labour | Gerald Fowler | 23,692 | 50.9 | +8.2 | |
| Conservative | William Yates | 22,846 | 49.1 | +0.4 | |
| Majority | 846 | 1.8 | N/A | ||
| Turnout | 81.3 | -0.7 | |||
| Labour gain from Conservative | Swing | ||||
| Party | Candidate | Votes | % | ± | |
|---|---|---|---|---|---|
| Conservative | William Yates | 21,765 | 48.7 | ||
| Labour | Donald Bruce | 19,078 | 42.7 | ||
| Liberal | John Nicholas Davies | 3,839 | 8.6 | ||
| Majority | 2,687 | 6.0 | |||
| Turnout | 82.0 | ||||
| Conservative hold | Swing | ||||
Elections in the 1950s
| Party | Candidate | Votes | % | ± | |
|---|---|---|---|---|---|
| Conservative | William Yates | 22,030 | 53.6 | ||
| Labour | Donald Bruce | 19,052 | 46.4 | ||
| Majority | 2,978 | 7.2 | |||
| Turnout | 84.20 | ||||
| Conservative hold | Swing | ||||
| Party | Candidate | Votes | % | ± | |
|---|---|---|---|---|---|
| Conservative | William Yates | 19,019 | 50.6 | ||
| Labour | Ivor Owen Thomas | 18,541 | 49.4 | ||
| Majority | 478 | 1.2 | |||
| Turnout | 80.1 | ||||
| Conservative gain from Labour | Swing | ||||
| Party | Candidate | Votes | % | ± | |
|---|---|---|---|---|---|
| Labour | Ivor Owen Thomas | 20,109 | 52.4 | ||
| Conservative | John Cordle | 18,305 | 46.7 | ||
| Majority | 1,804 | 4.7 | |||
| Turnout | 83.1 | ||||
| Labour hold | Swing | ||||
| Party | Candidate | Votes | % | ± | |
|---|---|---|---|---|---|
| Labour | Ivor Owen Thomas | 19,730 | 53.7 | ||
| Conservative | F.G. Bibbings | 17,039 | 46.3 | ||
| Majority | 2,691 | 7.4 | |||
| Turnout | 81.3 | ||||
| Labour hold | Swing | ||||
Elections in the 1940s
| Party | Candidate | Votes | % | ± | |
|---|---|---|---|---|---|
| Labour | Ivor Owen Thomas | 22,453 | 56.3 | +14.2 | |
| Conservative | Arthur Colegate | 17,422 | 43.7 | ||
| Majority | 5,031 | 12.6 | N/A | ||
| Turnout | 72.3 | ||||
| Labour gain from Conservative | Swing | ||||
| Party | Candidate | Votes | % | ± | |
|---|---|---|---|---|---|
| Conservative | Arthur Colegate | 9,946 | 53.2 | ||
| Ind. Conservative | Noel Pemberton Billing | 7,121 | 38.1 | ||
| Independent | Arthur Patrick Kennedy | 1,638 | 8.8 | ||
| Majority | 2,825 | 15.1 | |||
| Turnout | 18,705 | ||||
| Conservative hold | Swing | ||||
Elections in the 1930s
General Election 1939/40:
Another General Election was required to take place before the end of 1940. The political parties had been making preparations for an election to take place from 1939 and by the end of this year, the following candidates had been selected;
- Conservative: James Baldwin-Webb
- Labour: Ivor Owen Thomas
| Party | Candidate | Votes | % | ± | |
|---|---|---|---|---|---|
| Conservative | James Baldwin-Webb | 20,665 | 57.9 | ||
| Labour | Geoffrey Garratt | 15,040 | 42.1 | ||
| Majority | 5,625 | 15.8 | |||
| Turnout | 78.5 | ||||
| Conservative hold | Swing | ||||
| Party | Candidate | Votes | % | ± | |
|---|---|---|---|---|---|
| Conservative | James Baldwin-Webb | 22,258 | 61.1 | +25.5 | |
| Labour | Edith Picton-Turbervill | 14,162 | 38.9 | -4.5 | |
| Majority | 8,096 | 22.2 | N/A | ||
| Turnout | 83.2 | +6.5 | |||
| Conservative gain from Labour | Swing | ||||
Elections in the 1920s
| Party | Candidate | Votes | % | ± | |
|---|---|---|---|---|---|
| Labour | Edith Picton-Turbervill | 14,569 | 44.4 | ||
| Unionist | Thomas Oakley | 11,707 | 35.6 | ||
| Liberal | W. E. Boyes | 6,575 | 20.0 | ||
| Majority | 2,862 | 8.8 | |||
| Turnout | 32,851 | 76.7 | |||
| Registered electors | 42,823 | ||||
| Labour gain from Unionist | Swing | ||||
| Party | Candidate | Votes | % | ± | |
|---|---|---|---|---|---|
| Unionist | Thomas Oakley | 14,003 | 55.7 | ||
| Labour | Henry Nixon | 11,132 | 44.4 | ||
| Majority | 2,871 | 11.3 | |||
| Turnout | 25,135 | 74.2 | |||
| Registered electors | 33,866 | ||||
| Unionist gain from Labour | Swing | ||||
| Party | Candidate | Votes | % | ± | |
|---|---|---|---|---|---|
| Labour | Henry Nixon | 11,657 | 53.2 | ||
| Unionist | Arthur Nicholas Fielden | 10,274 | 46.8 | ||
| Majority | 1,383 | 6.4 | N/A | ||
| Turnout | 21,931 | 66.0 | |||
| Registered electors | 33,253 | ||||
| Labour gain from Unionist | Swing | ||||
| Party | Candidate | Votes | % | ± | |
|---|---|---|---|---|---|
| Unionist | Howard Button | 11,652 | 52.4 | ||
| Labour | Richard Edward Jones | 10,603 | 47.6 | ||
| Majority | 1,049 | 4.8 | |||
| Turnout | 22,255 | 67.8 | |||
| Registered electors | 32,844 | ||||
| Unionist gain from Liberal | Swing | ||||

| Party | Candidate | Votes | % | ± | |
|---|---|---|---|---|---|
| Independent Parliamentary Group | Charles Townshend | 14,565 | 57.9 | ||
| Labour | Charles Duncan | 10,600 | 42.1 | ||
| Majority | 3,965 | 15.8 | |||
| Turnout | 25,165 | 78.3 | |||
| Registered electors | 32,053 | ||||
| Independent Parliamentary Group hold | Swing | ||||
| Party | Candidate | Votes | % | ± | |
|---|---|---|---|---|---|
| Independent Parliamentary Group | Charles Palmer | 9,267 | 40.7 | ||
| Labour | Charles Duncan | 8,729 | 38.4 | ||
| C | Liberal | John Bayley | 4,750 | 20.9 | |
| Majority | 538 | 2.3 | N/A | ||
| Turnout | 22,746 | 71.0 | |||
| Independent Parliamentary Group gain from Liberal | Swing | ||||
| C indicates candidate endorsed by the coalition government. | |||||
Elections in the 1910s

| Party | Candidate | Votes | % | ± | |
|---|---|---|---|---|---|
| C | Liberal | Charles Henry | Unopposed | ||
| Liberal win (new seat) | |||||
| C indicates candidate endorsed by the coalition government. | |||||
Notes and references
- Notes
- A county constituency (for the purposes of election expenses and type of returning officer)
- As with all British constituencies, it elects one Member of Parliament (MP) by the first past the post system of election at least every five years.
- References
- "Electorate Figures – Boundary Commission for England". 2011 Electorate Figures. Boundary Commission for England. 4 March 2011. Archived from the original on 6 November 2010. Retrieved 13 March 2011.
- "31. County of Salop" in "Report of the Parliamentary Boundary Commission (England and Wales)" Cd. 8756.
- "BBC/ITN Guide to the New Parliamentary Constituencies", 1983, p. 143, 230.
- "Media Guide to the New Parliamentary Constituencies", BBC/ITN/PA News/Sky, 1995, p. 181, 267.
- "2010 post-revision map non-metropolitan areas and unitary authorities of England" (PDF).
- "It's All Change For MPs, Political map to be transformed". Shropshire Star. 13 September 2016. p. 1.Report by Mark Andrews.
- Unemployment claimants by constituency The Guardian
- Leigh Rayment's Historical List of MPs – Constituencies beginning with "W" (part 5)
- "Wrekin, The Parliamentary constituency". BBC News. BBC. Retrieved 30 November 2019.
- "Shrewsbury & Atcham Parliamentary constituency". BBC News.
- "Election Data 2015". Electoral Calculus. Archived from the original on 17 October 2015. Retrieved 17 October 2015.
- "Telford & Wrekin Green Party - People". greenparty.org.uk.
- "Election Data 2010". Electoral Calculus. Archived from the original on 26 July 2013. Retrieved 17 October 2015.
- "Election Data 2005". Electoral Calculus. Archived from the original on 15 October 2011. Retrieved 18 October 2015.
- "Election Data 2001". Electoral Calculus. Archived from the original on 15 October 2011. Retrieved 18 October 2015.
- "Election Data 1997". Electoral Calculus. Archived from the original on 15 October 2011. Retrieved 18 October 2015.
- "Politics Resources". Election 1992. Politics Resources. 9 April 1992. Retrieved 6 December 2010.
- "Election Data 1987". Electoral Calculus. Archived from the original on 15 October 2011. Retrieved 18 October 2015.
- "Election Data 1983". Electoral Calculus. Archived from the original on 15 October 2011. Retrieved 18 October 2015.
- British Parliamentary Election Results 1918-1949, FWS Craig
- The Constitutional Year Book, 1929
- The Constitutional Year Book, 1925
- Debretts House of Commons & Judicial Bench, 1922