Bolton West (UK Parliament constituency)
Bolton West is a constituency[n 1] represented in the House of Commons of the UK Parliament since 2015 by Chris Green, a Conservative.[n 2]
| Bolton West | |
|---|---|
| County constituency for the House of Commons | |
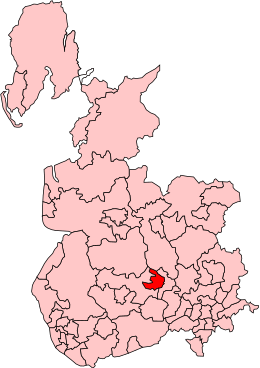
 Boundary of Bolton West in Greater Manchester | |
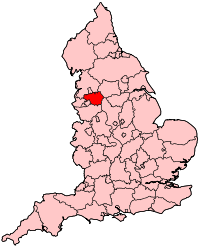
 Location of Greater Manchester within England | |
| County | Greater Manchester |
| Population | 94,523 (2011 census)[1] |
| Electorate | 71,454 (December 2010)[2] |
| Major settlements | Atherton, Blackrod, Heaton, Horwich, Westhoughton |
| Current constituency | |
| Created | 1950 |
| Member of Parliament | Chris Green (Conservative) |
| Number of members | One |
| Created from | Bolton |
Constituency profile
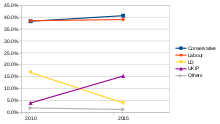
The seat is on the outskirts of Greater Manchester with fields making for separate villages and towns, these buffer zones most often designated as Green belt which includes areas for sport, plus features the ground of Bolton Wanderers at the University of Bolton Stadium. To the seat has been a marginal seat[n 3] between the Labour and the Conservative parties, with two and three-figure majorities for the elections between 2010-2017. However, the 2019 General Election saw it become a relatively safe Conservative seat as Chris Green achieved the highest numerical majority for any candidate in the seat's history, and a majority (55%) of the votes, the first time that has been achieved since 1970.
Boundaries

1950–1983: The County Borough of Bolton wards of Deane-cum-Lostock, Derby, Halliwell, Heaton, Rumworth, Smithills, and West.
1983–1997: The Borough of Bolton wards of Blackrod, Deane-cum-Heaton, Halliwell, Horwich, Hulton Park, Smithills, and Westhoughton.
1997–2010: The Borough of Bolton wards of Blackrod, Deane-cum-Heaton, Horwich, Hulton Park, Smithills, and Westhoughton.
2010–present: The Borough of Bolton wards of Halliwell, Heaton and Lostock, Horwich and Blackrod, Horwich North East, Smithills, Deane Westhoughton North and Chew Moor, and Westhoughton South, and the Borough of Wigan ward of Atherton.
There were major boundary changes to Bolton West in 1983 when part of its area went to create Bolton North East, but compensated by taking most of the former Westhoughton constituency.
Members of Parliament
| Election | Member[3] | Party | |
|---|---|---|---|
| 1950 | John Lewis | Labour | |
| 1951 | Arthur Holt | Liberal | |
| 1964 | Gordon Oakes | Labour | |
| 1970 | Robert Redmond | Conservative | |
| Oct 1974 | Ann Taylor | Labour | |
| 1983 | Tom Sackville | Conservative | |
| 1997 | Ruth Kelly | Labour | |
| 2010 | Julie Hilling | Labour | |
| 2015 | Chris Green | Conservative | |
Elections
Elections in the 2010s
| Party | Candidate | Votes | % | ± | |
|---|---|---|---|---|---|
| Conservative | Chris Green | 27,255 | 55.3 | +7.4 | |
| Labour | Julie Hilling | 18,400 | 37.3 | −8.8 | |
| Liberal Democrats | Rebecca Forrest | 2,704 | 5.5 | +2.5 | |
| Green | Paris Hayes | 939 | 1.9 | New | |
| Majority | 8,855 | 18.0 | |||
| Turnout | 49,298 | 67.4 | |||
| Conservative hold | Swing | ||||

| Party | Candidate | Votes | % | ± | |
|---|---|---|---|---|---|
| Conservative | Chris Green | 24,459 | 47.9 | +7.3 | |
| Labour | Julie Hilling | 23,523 | 46.1 | +7.1 | |
| UKIP | Martin Tighe | 1,587 | 3.1 | −12.2 | |
| Liberal Democrats | Becky Forrest | 1,485 | 2.9 | −1.1 | |
| Majority | 936 | 1.8 | +0.2 | ||
| Turnout | 51,054 | 70.1 | +3.3 | ||
| Conservative hold | Swing | +0.1 | |||
| Party | Candidate | Votes | % | ± | |
|---|---|---|---|---|---|
| Conservative | Chris Green | 19,744 | 40.6 | +2.3 | |
| Labour | Julie Hilling | 18,943 | 39.0 | +0.5 | |
| UKIP | Bob Horsefield | 7,428 | 15.3 | +11.3 | |
| Liberal Democrats | Andrew Martin | 1,947 | 4.0 | −13.2 | |
| Independent | Andy Smith | 321 | 0.7 | N/A | |
| TUSC | John Vickers | 209 | 0.4 | N/A | |
| Majority | 801 | 1.6 | N/A | ||
| Turnout | 48,592 | 66.8 | None | ||
| Conservative gain from Labour | Swing | +0.9 | |||
| Party | Candidate | Votes | % | ± | |
|---|---|---|---|---|---|
| Labour | Julie Hilling | 18,327 | 38.5 | −6.8 | |
| Conservative | Susan Williams | 18,235 | 38.3 | +5.9 | |
| Liberal Democrats | Jackie Pearcey | 8,177 | 17.2 | −1.8 | |
| UKIP | Harry Lamb | 1,901 | 4.0 | +2.6 | |
| Green | Rachel Mann | 545 | 1.1 | N/A | |
| Independent | Jimmy Jones | 254 | 0.5 | N/A | |
| You Party | Doug Bagnall | 137 | 0.3 | N/A | |
| Majority | 92 | 0.19 | -4.9 | ||
| Turnout | 47,576 | 66.8 | +3.3 | ||
| Labour hold | Swing | −5.9 | |||
Elections in the 2000s
| Party | Candidate | Votes | % | ± | |
|---|---|---|---|---|---|
| Labour | Ruth Kelly | 17,239 | 42.5 | −4.5 | |
| Conservative | Philip Allott | 15,175 | 37.4 | +3.8 | |
| Liberal Democrats | Tim Perkins | 7,241 | 17.9 | −0.5 | |
| UKIP | Marjorie Ford | 524 | 1.3 | N/A | |
| Veritas | Michael Ford | 290 | 0.7 | N/A | |
| Xtraordinary People | Kate Griggs | 74 | 0.2 | N/A | |
| Majority | 2,064 | 5.1 | -8.3 | ||
| Turnout | 40,543 | 63.5 | +1.1 | ||
| Labour hold | Swing | −4.2 | |||
| Party | Candidate | Votes | % | ± | |
|---|---|---|---|---|---|
| Labour | Ruth Kelly | 19,381 | 47.0 | −2.5 | |
| Conservative | James Stevens | 13,863 | 33.6 | −1.5 | |
| Liberal Democrats | Barbara Ronson[10] | 7,573 | 18.4 | +7.6 | |
| Socialist Alliance | David Toomer | 397 | 1.0 | N/A | |
| Majority | 5,518 | 13.4 | -1.0 | ||
| Turnout | 41,214 | 62.4 | −14.9 | ||
| Labour hold | Swing | −0.5 | |||
Elections in the 1990s
| Party | Candidate | Votes | % | ± | |
|---|---|---|---|---|---|
| Labour | Ruth Kelly | 24,342 | 49.5 | +10.4 | |
| Conservative | Tom Sackville | 17,270 | 35.1 | -12.2 | |
| Liberal Democrats | Barbara Ronson[10] | 5,309 | 10.8 | -2.4 | |
| Socialist Labour | Doris Kelly | 1,374 | 2.80 | N/A | |
| Referendum | Glenda Frankl-Slater | 865 | 1.76 | N/A | |
| Majority | 7,072 | 14.39 | N/A | ||
| Turnout | 49,160 | 77.3 | -6.2 | ||
| Labour gain from Conservative | Swing | +11.3 | |||
| Party | Candidate | Votes | % | ± | |
|---|---|---|---|---|---|
| Conservative | Tom Sackville | 26,452 | 44.4 | +0.1 | |
| Labour | Clifford Morris[17] | 25,373 | 42.6 | +6.5 | |
| Liberal Democrats | Barbara Ronson[10] | 7,529 | 12.6 | −6.9 | |
| Natural Law | Jacqueline Phillips | 240 | 0.4 | N/A | |
| Majority | 1,079 | 1.8 | −6.4 | ||
| Turnout | 59,594 | 83.5 | +3.5 | ||
| Conservative hold | Swing | −3.2 | |||
Elections in the 1980s
| Party | Candidate | Votes | % | ± | |
|---|---|---|---|---|---|
| Conservative | Tom Sackville | 24,779 | 44.3 | -0.8 | |
| Labour | Guy Harkin | 20,186 | 36.1 | +4.6 | |
| SDP | David Eccles | 10,936 | 19.6 | -4.9 | |
| Majority | 4,593 | 8.22 | |||
| Turnout | 80.04 | +1.9 | |||
| Conservative hold | Swing | -2.69 | |||
| Party | Candidate | Votes | % | ± | |
|---|---|---|---|---|---|
| Conservative | Tom Sackville | 23,731 | 45.09 | +1.79 | |
| Labour | Dennis Green | 16,579 | 31.50 | -11.80 | |
| SDP | Ron Baker | 12,321 | 23.41 | N/A | |
| Majority | 7,152 | 13.59 | |||
| Turnout | 78.14 | - 1.22 | |||
| Conservative gain from Labour | |||||
Elections in the 1970s
| Party | Candidate | Votes | % | ± | |
|---|---|---|---|---|---|
| Labour | Ann Taylor | 17,857 | 44.81 | +1.55 | |
| Conservative | B. H. Watson | 17,257 | 43.30 | +2.45 | |
| Liberal | J. Fish | 4,392 | 11.02 | -2.05 | |
| National Front | K. Bernal | 348 | 0.87 | -1.85 | |
| Majority | 600 | 1.51 | |||
| Turnout | 39,854 | 79.36 | + 2.12 | ||
| Labour hold | |||||
| Party | Candidate | Votes | % | ± | |
|---|---|---|---|---|---|
| Labour | Ann Taylor | 16,967 | 43.26 | +4.13 | |
| Conservative | Robert Redmond | 16,061 | 40.95 | -2.35 | |
| Liberal | Philip Stefan Linney[24] | 5,127 | 13.07 | -7.19 | |
| National Front | W. Roberts | 1,070 | 2.73 | +2.73 | |
| Majority | 906 | 2.31 | |||
| Turnout | 39,305 | 77.24 | |||
| Labour gain from Conservative | |||||
| Party | Candidate | Votes | % | ± | |
|---|---|---|---|---|---|
| Conservative | Robert Redmond | 16,562 | 40.61 | -11.06 | |
| Labour | Ann Taylor | 15,959 | 39.13 | -9.20 | |
| Liberal | Philip Stefan Linney[24] | 8,264 | 20.26 | +20.26 | |
| Majority | 603 | 1.48 | |||
| Turnout | 40,685 | 81.06 | +7.07 | ||
| Conservative hold | |||||
| Party | Candidate | Votes | % | ± | |
|---|---|---|---|---|---|
| Conservative | Robert Redmond | 19,225 | 51.67 | +13.93 | |
| Labour | Gordon Oakes | 17,981 | 48.33 | -2.24 | |
| Majority | 1,244 | 3.34 | |||
| Turnout | 37,216 | 73.99 | -4.3 | ||
| Conservative gain from Labour | |||||
Elections in the 1960s
| Party | Candidate | Votes | % | ± | |
|---|---|---|---|---|---|
| Labour | Gordon Oakes | 19,390 | 50.57 | +9.40 | |
| Conservative | Christopher BS Dobson | 14,473 | 37.74 | + 4.04 | |
| Liberal | Robert Glenton | 4,483 | 11.69 | -14.45 | |
| Majority | 4,917 | 12.82 | |||
| Turnout | 40,127 | 78.29 | +0.14 | ||
| Labour hold | |||||
| Party | Candidate | Votes | % | ± | |
|---|---|---|---|---|---|
| Labour | Gordon Oakes | 16,519 | 41.17 | -4.20 | |
| Conservative | Douglas Sisson | 13,522 | 33.70 | + 33.70 | |
| Liberal | Arthur Holt | 10,086 | 25.14 | - 29.49 | |
| Majority | 2,997 | 7.47 | |||
| Turnout | 38,346 | 78.15 | -1.67 | ||
| Labour gain from Liberal | |||||
Elections in the 1950s
| Party | Candidate | Votes | % | ± | |
|---|---|---|---|---|---|
| Liberal | Arthur Holt | 23,533 | 54.63 | -0.74 | |
| Labour | Peter Cameron | 19,545 | 45.37 | +0.74 | |
| Majority | 3,988 | 9.26 | |||
| Turnout | 43,078 | 79.72 | +0.65 | ||
| Liberal hold | |||||
| Party | Candidate | Votes | % | ± | |
|---|---|---|---|---|---|
| Liberal | Arthur Holt | 24,827 | 55.37 | +2.61 | |
| Labour | James Haworth | 20,014 | 44.63 | -2.61 | |
| Majority | 4,813 | 10.73 | |||
| Turnout | 44,841 | 79.05 | - 5.74 | ||
| Liberal hold | |||||
| Party | Candidate | Votes | % | ± | |
|---|---|---|---|---|---|
| Liberal | Arthur Holt | 26,271 | 52.76 | +32.30 | |
| Labour | John Lewis | 23,523 | 47.24 | +2.62 | |
| Majority | 2,748 | 5.52 | - | ||
| Turnout | 49,794 | 84.79 | -2.76 | ||
| Liberal gain from Labour | |||||
| Party | Candidate | Votes | % | ± | |
|---|---|---|---|---|---|
| Labour | John Lewis | 23,232 | 44.62 | N/A | |
| Conservative | Walter Wharton Tong[36] | 18,184 | 34.92 | N/A | |
| Liberal | Alan Lever Tillotson | 10,653 | 20.46 | N/A | |
| Majority | 5,048 | 9.69 | N/A | ||
| Turnout | 52,069 | 87.55 | N/A | ||
| Labour win (new seat) | |||||
Notes
- A county constituency (for the purposes of election expenses and type of returning officer)
- As with all constituencies, the constituency elects one Member of Parliament (MP) by the first past the post system of election at least every five years.
- As it has most often given marginal majorities of less than 10%
References
- "Bolton West: Usual Resident Population, 2011". Neighbourhood Statistics. Office for National Statistics. Retrieved 31 January 2015.
- "Electorate Figures - Boundary Commission for England". 2011 Electorate Figures. Boundary Commission for England. 4 March 2011. Archived from the original on 22 October 2012. Retrieved 8 January 2014.
- Leigh Rayment's Historical List of MPs – Constituencies beginning with "B" (part 4)
- Sansome, Jessica; Otter, Saffron (14 November 2019). "All the Greater Manchester General Election 2019 candidates". men. Retrieved 15 November 2019.
- "Election Data 2015". Electoral Calculus. Archived from the original on 17 October 2015. Retrieved 17 October 2015.
- "Bolton West". BBC News. Retrieved 10 May 2015.
- "Election Data 2010". Electoral Calculus. Archived from the original on 26 July 2013. Retrieved 17 October 2015.
- "Election Data 2005". Electoral Calculus. Archived from the original on 15 October 2011. Retrieved 18 October 2015.
- "Election Data 2001". Electoral Calculus. Archived from the original on 15 October 2011. Retrieved 18 October 2015.
- Barbara Olwyn Ronson. Links in a Chain. Retrieved on 13 May 2010.
- "Election Data 1997". Electoral Calculus. Archived from the original on 15 October 2011. Retrieved 18 October 2015.
- General Election Results 1997 and 2001: Bolton West Archived 3 March 2016 at the Wayback Machine. Political Science Resources. Retrieved 14 May 2010.
- General Election 1997: Bolton West. BBC. Retrieved 17 May 2010.
- "Election Data 1992". Electoral Calculus. Archived from the original on 15 October 2011. Retrieved 18 October 2015.
- General Election 9 April 1992: Bolton West Archived 11 August 2011 at the Wayback Machine. Political Science Resources. Retrieved 14 May 2010.
- "UK General Election results April 1992". Richard Kimber's Political Science Resources. Politics Resources. 9 April 1992. Archived from the original on 11 August 2011. Retrieved 6 December 2010.
- Clifford Morris. Links in a Chain. Retrieved on 13 May 2010.
- "Election Data 1987". Electoral Calculus. Archived from the original on 15 October 2011. Retrieved 18 October 2015.
- General Election 11 June 1987: Bolton West Archived 11 August 2011 at the Wayback Machine. Political Science Resources. Retrieved 14 May 2010.
- "Election Data 1983". Electoral Calculus. Archived from the original on 15 October 2011. Retrieved 18 October 2015.
- General Election 9 June 1983: Bolton West Archived 28 June 2017 at the Wayback Machine. Political Science Resources. Retrieved 14 May 2010.
- General Election 3 May 1979: Bolton West. Political Science Resources. Retrieved 14 May 2010.
- General Election 10 October 1974: Bolton West. Political Science Resources. Retrieved 14 May 2010.
- Philip Stefan Linney. Links in a Chain. Retrieved on 13 May 2010.
- General Election 28 February 1974: Bolton West. Political Science Resources. Retrieved 14 May 2010.
- General Election 18 June 1970: Bolton West. Political Science Resources. Retrieved 14 May 2010.
- General Election 31 March 1966: Bolton West. Political Science Resources. Retrieved 14 May 2010.
- General Election 15 October 1964: Bolton West. Political Science Resources. Retrieved 14 May 2010.
- General Election 8 October 1959: Bolton West. Political Science Resources. Retrieved 14 May 2010.
- General Election 26 May 1955: Bolton West. Political Science Resources. Retrieved 14 May 2010.
- General Election 25 October 1951: Bolton West. Political Science Resources. Retrieved 14 May 2010.
- General Election 23 February 1950: Bolton West. Political Science Resources. Retrieved 14 May 2010.
- Walter Wharton Tong. Links in a Chain. Retrieved on 13 May 2010.
External links
- nomis Constituency Profile for Bolton West — presenting data from the ONS annual population survey and other official statistics.