Bolton North East (UK Parliament constituency)
Bolton North East is a constituency[n 1] represented in the House of Commons of the UK Parliament.[n 2]
| Bolton North East | |
|---|---|
| Borough constituency for the House of Commons | |
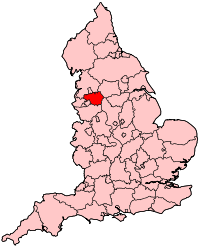
 Boundary of Bolton North East in Greater Manchester | |
 Location of Greater Manchester within England | |
| County | Greater Manchester |
| Population | 95,288 (2011 census)[1] |
| Electorate | 66,600 (December 2010)[2] |
| Major settlements | Bromley Cross |
| Current constituency | |
| Created | 1983 |
| Member of Parliament | Mark Logan (Conservative) |
| Number of members | One |
| Created from | Bolton West Bolton East Darwen[3] |
Constituency profile
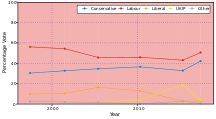
Bolton North East has more often than not to date been a marginal seat[n 3] between Labour and Conservative candidates. In 1992, David Crausby came tantalisingly close to gaining the seat, as Labour were expecting to do. It would not be until 1997 that Labour gained the seat, with a huge 12,000 majority, holding it for the next 22 years. Altogether the national statistics collected reflect a socially diverse seat in terms of income, this has been a highly marginal seat when national polls are close, with lower than average social housing and a lower ranking in the Index of Multiple Deprivation than the average for the metropolitan county.[4]
Boundaries
1983–1997: The Metropolitan Borough of Bolton wards of Astley Bridge, Bradshaw, Breightmet, Bromley Cross, Central, and Tonge.
1997–2010: The Metropolitan Borough of Bolton wards of Astley Bridge, Bradshaw, Breightmet, Bromley Cross, Central, Halliwell, and Tonge.
2010–present: The Metropolitan Borough of Bolton wards of Astley Bridge, Bradshaw, Breightmet, Bromley Cross, Crompton, Halliwell, and Tonge with the Haulgh.
Bolton North East was created for the 1983 general election from parts of the constituencies of Bolton West and the former Bolton East. It covers Bolton's town centre, and the districts in close proximity (Breightmet, Crompton, Halliwell, Tonge with the Haulgh) are Labour-voting areas, whereas the outer suburbs (Astley Bridge, Bradshaw, Bromley Cross) are much more Conservative inclined. Labour comfortably held the seat in 2010, with very little swing from the previous election.
Members of Parliament
| Election | Member[5] | Party | |
|---|---|---|---|
| 1983 | Peter Thurnham | Conservative | |
| 1996 | Liberal Democrat | ||
| 1997 | Sir David Crausby | Labour | |
| 2019 | Mark Logan | Conservative | |
Elections

Elections in the 2010s
| Party | Candidate | Votes | % | ± | |
|---|---|---|---|---|---|
| Conservative | Mark Logan | 19,759 | 45.4 | +3.2 | |
| Labour | David Crausby | 19,381 | 44.5 | −6.1 | |
| Brexit Party | Trevor Jones | 1,880 | 4.3 | New | |
| Liberal Democrats | Warren Fox | 1,847 | 4.2 | +1.3 | |
| Green | Liz Spencer | 689 | 1.6 | +0.8 | |
| Majority | 378 | 0.9 | N/A | ||
| Turnout | 43,556 | 64.5 | -2.7 | ||
| Conservative gain from Labour | Swing | +4.7 | |||
| Party | Candidate | Votes | % | ± | |
|---|---|---|---|---|---|
| Labour | David Crausby | 22,870 | 50.6 | +7.6 | |
| Conservative | James Daly | 19,073 | 42.2 | +9.4 | |
| UKIP | Harry Lamb | 1,567 | 3.5 | −15.3 | |
| Liberal Democrats | Warren Fox | 1,316 | 2.9 | 0.0 | |
| Green | Liz Spencer | 357 | 0.8 | −1.8 | |
| Majority | 3,797 | 8.4 | −1.7 | ||
| Turnout | 45,183 | 67.2 | +3.6 | ||
| Labour hold | Swing | −0.8 | |||
| Party | Candidate | Votes | % | ± | |
|---|---|---|---|---|---|
| Labour | David Crausby | 18,541 | 43.0 | −3.1 | |
| Conservative | James Daly | 14,164 | 32.8 | −3.7 | |
| UKIP | Harry Lamb | 8,117 | 18.8 | +14.6 | |
| Liberal Democrats | Stephen Rock | 1,236 | 2.9 | −10.1 | |
| Green | Laura Diggle | 1,103 | 2.6 | New | |
| Majority | 4,377 | 10.1 | +0.7 | ||
| Turnout | 43,161 | 63.6 | −0.7 | ||
| Labour hold | Swing | ||||
| Party | Candidate | Votes | % | ± | |
|---|---|---|---|---|---|
| Labour | David Crausby | 19,870 | 45.9 | −0.4 | |
| Conservative | Deborah Dunleavy | 15,786 | 36.5 | +2.2 | |
| Liberal Democrats | Paul Ankers | 5,624 | 13.0 | −3.1 | |
| UKIP | Neil Johnson | 1,815 | 4.2 | +2.4 | |
| You Party | Norma Armston | 182 | 0.4 | New | |
| Majority | 4,084 | 9.4 | −2.5 | ||
| Turnout | 43,277 | 64.3 | +9.8 | ||
| Labour hold | Swing | −1.3 | |||
Elections in the 2000s
| Party | Candidate | Votes | % | ± | |
|---|---|---|---|---|---|
| Labour | David Crausby | 16,874 | 45.7 | −8.6 | |
| Conservative | Paul Brierley | 12,771 | 34.6 | +1.9 | |
| Liberal Democrats | Adam Killeya | 6,044 | 16.4 | +6.1 | |
| UKIP | Kevin Epsom | 640 | 1.7 | New | |
| Veritas | Alan Ainscow | 375 | 1.0 | New | |
| Socialist Labour | Lynne Lowe | 207 | 0.6 | −0.4 | |
| Majority | 4,103 | 11.1 | -10.5 | ||
| Turnout | 36,911 | 54.8 | −1.2 | ||
| Labour hold | Swing | −5.2 | |||
| Party | Candidate | Votes | % | ± | |
|---|---|---|---|---|---|
| Labour | David Crausby | 21,166 | 54.3 | −1.8 | |
| Conservative | Michael Winstanley | 12,744 | 32.7 | +2.3 | |
| Liberal Democrats | Tim Perkins | 4,004 | 10.3 | +0.4 | |
| Green | Kenneth McIvor | 629 | 1.6 | New | |
| Socialist Labour | Lynne Lowe | 407 | 1.0 | −0.4 | |
| Majority | 8,422 | 21.6 | -4.1 | ||
| Turnout | 38,950 | 56.0 | −16.4 | ||
| Labour hold | Swing | ||||
Elections in the 1990s
| Party | Candidate | Votes | % | ± | |
|---|---|---|---|---|---|
| Labour | David Crausby | 27,621 | 56.13 | ||
| Conservative | Rob Wilson | 14,952 | 30.39 | ||
| Liberal Democrats | Edmund Critchley | 4,862 | 9.88 | ||
| Referendum | David Staniforth | 1,096 | 2.23 | ||
| Socialist Labour | William Kelly | 676 | 1.37 | ||
| Majority | 12,669 | 25.75 | |||
| Turnout | 49,207 | 72.37 | |||
| Labour gain from Conservative | Swing | 10.2 | |||
| Party | Candidate | Votes | % | ± | |
|---|---|---|---|---|---|
| Conservative | Peter Thurnham | 21,644 | 44.9 | +0.5 | |
| Labour | David Crausby | 21,459 | 44.5 | +1.8 | |
| Liberal Democrats | Brian Dunning | 4,971 | 10.3 | −2.7 | |
| Natural Law | Peter Tong | 181 | 0.4 | New | |
| Majority | 185 | 0.4 | −1.3 | ||
| Turnout | 48,255 | 82.3 | +3.6 | ||
| Conservative hold | Swing | −0.7 | |||
Elections in the 1980s
| Party | Candidate | Votes | % | ± | |
|---|---|---|---|---|---|
| Conservative | Peter Thurnham | 20,742 | 44.4 | +1.2 | |
| Labour | Frank White[21] | 19,929 | 42.7 | +4.9 | |
| SDP | John Alcock | 6,060 | 13.0 | −5.3 | |
| Majority | 813 | 1.7 | -3.7 | ||
| Turnout | 46,731 | 78.7 | +1.6 | ||
| Conservative hold | Swing | ||||
| Party | Candidate | Votes | % | ± | |
|---|---|---|---|---|---|
| Conservative | Peter Thurnham | 19,632 | 43.2 | N/A | |
| Labour | Ann Taylor | 17,189 | 37.8 | N/A | |
| SDP | John Alcock | 8,311 | 18.3 | N/A | |
| BNP | David P. Ball | 186 | 0.4 | N/A | |
| Independent | Thomas Keen | 104 | 0.2 | N/A | |
| Majority | 2,443 | 5.4 | N/A | ||
| Turnout | 45,318 | 77.1 | N/A | ||
| Conservative win (new seat) | |||||
Notes and references
- Notes
- A borough constituency (for the purposes of election expenses and type of returning officer)
- As with all constituencies, the constituency elects one Member of Parliament (MP) by the first past the post system of election at least every five years.
- As it has more often than not given marginal majorities of less than 10%
- References
- "Bolton North East: Usual Resident Population, 2011". Neighbourhood Statistics. Office for National Statistics. Retrieved 31 January 2015.
- "Electorate Figures – Boundary Commission for England". 2011 Electorate Figures. Boundary Commission for England. 4 March 2011. Archived from the original on 6 November 2010. Retrieved 13 March 2011.
- "'Bolton North East', June 1983 up to May 1997". ElectionWeb Project. Cognitive Computing Limited. Archived from the original on 11 March 2016. Retrieved 10 March 2016.
- "Local statistics - Office for National Statistics". neighbourhood.statistics.gov.uk.
- Leigh Rayment's Historical List of MPs – Constituencies beginning with "B" (part 4)
- Sansome, Jessica; Otter, Saffron (14 November 2019). "All the Greater Manchester General Election 2019 candidates". men. Retrieved 15 November 2019.
- "Bolton North East parliamentary constituency". BBC News.
- "Election Data 2015". Electoral Calculus. Archived from the original on 17 October 2015. Retrieved 17 October 2015.
- "Bolton North East". BBC News. Retrieved 11 May 2015.
- "Election Data 2010". Electoral Calculus. Archived from the original on 26 July 2013. Retrieved 17 October 2015.
- "Election 2010 - Constituency - Bolton North East". BBC News -.
- "Election Data 2005". Electoral Calculus. Archived from the original on 15 October 2011. Retrieved 18 October 2015.
- "Election Data 2001". Electoral Calculus. Archived from the original on 15 October 2011. Retrieved 18 October 2015.
- "Election Data 1997". Electoral Calculus. Archived from the original on 15 October 2011. Retrieved 18 October 2015.
- General Election Results 1997 and 2001: Bolton North East Archived 3 March 2016 at the Wayback Machine. Political Science Resources. Retrieved 14 May 2010.
- General Election 1997: Bolton North East. BBC. Retrieved 17 May 2010.
- "Election Data 1992". Electoral Calculus. Archived from the original on 15 October 2011. Retrieved 18 October 2015.
- "UK General Election results April 1992". Richard Kimber's Political Science Resources. Politics Resources. 9 April 1992. Archived from the original on 11 August 2011. Retrieved 6 December 2010.
- "Election Data 1987". Electoral Calculus. Archived from the original on 15 October 2011. Retrieved 18 October 2015.
- General Election 11 June 1987: Bolton North East Archived 11 August 2011 at the Wayback Machine. Political Science Resources. Retrieved 14 May 2010.
- Frank Richard White. Links in a Chain. Retrieved 14 May 2010.
- "Election Data 1983". Electoral Calculus. Archived from the original on 15 October 2011. Retrieved 18 October 2015.
- General Election 9 June 1983: Bolton North East Archived 28 June 2017 at the Wayback Machine. Political Science Resources. Retrieved 14 May 2010.
External links
- nomis Constituency Profile for Bolton North East — presenting data from the ONS annual population survey and other official statistics.