2014 European Parliament election in Finland
The 2014 European Parliament election in Finland for the election of the delegation from Finland to the European Parliament took place on 25 May 2014 with advance voting from 14 to 20 May.[2] Finnish voters elected thirteen members to the European Parliament.
| |||||||||||||||||||||||||||||||||||||||||||||||||||||||||||||||||||||||||||||||||||||||||||||||||||||||||||||||||||||||
All 13 Finnish seats to the European Parliament | |||||||||||||||||||||||||||||||||||||||||||||||||||||||||||||||||||||||||||||||||||||||||||||||||||||||||||||||||||||||
|---|---|---|---|---|---|---|---|---|---|---|---|---|---|---|---|---|---|---|---|---|---|---|---|---|---|---|---|---|---|---|---|---|---|---|---|---|---|---|---|---|---|---|---|---|---|---|---|---|---|---|---|---|---|---|---|---|---|---|---|---|---|---|---|---|---|---|---|---|---|---|---|---|---|---|---|---|---|---|---|---|---|---|---|---|---|---|---|---|---|---|---|---|---|---|---|---|---|---|---|---|---|---|---|---|---|---|---|---|---|---|---|---|---|---|---|---|---|---|---|
| Turnout | 39.1%[1] | ||||||||||||||||||||||||||||||||||||||||||||||||||||||||||||||||||||||||||||||||||||||||||||||||||||||||||||||||||||||
| |||||||||||||||||||||||||||||||||||||||||||||||||||||||||||||||||||||||||||||||||||||||||||||||||||||||||||||||||||||||

Hustings panel with Finnish political party chairpersons and top candidates on Europe Day 2014. Left to right: Sari Essayah, Mikael Pentikäinen, Jyrki Katainen, Timo Soini, Carl Haglund, Liisa Jaakonsaari, Paavo Arhinmäki, Ville Niinistö.
Results
| ← 2009 • 2014 • 2019 → | ||||||||
| National party | European party | Votes | % | +/– | Seats | +/– | ||
|---|---|---|---|---|---|---|---|---|
| National Coalition Party (KOK) | EPP | 390,376 | 22.6 | 0.6 |
3 / 13 |
0 | ||
| Centre Party (KESK) | ALDE | 339,895 | 19.7 | 0.6 |
3 / 13 |
0 | ||
| Finns Party (PS) | MELD | 222,457 | 12.9 | 3.1 |
2 / 13 |
1 | ||
| Social Democratic Party (SDP) | PES | 212,781 | 12.3 | 5.2 |
2 / 13 |
0 | ||
| Green League (VIHR) | EGP | 161,263 | 9.3 | 3.1 |
1 / 13 |
1 | ||
| Left Alliance (V) | NGLA / PEL | 161,074 | 9.3 | 3.4 |
1 / 13 |
1 | ||
| Swedish People's Party (SFP) | ALDE | 116,747 | 6.8 | 0.7 |
1 / 13 |
0 | ||
| Christian Democrats (KD) | EPP | 90,586 | 5.2 | 1.1 |
0 / 13 |
1 | ||
| Pirate Party | PPEU | 12,378 | 0.7 | 0.7 |
0 / 13 |
0 | ||
| Communist Party | PEL | 5,932 | 0.3 | 0.1 |
0 / 13 |
0 | ||
| Independence Party | None | 5,668 | 0.3 | 0.1 |
0 / 13 |
0 | ||
| Change 2011 | None | 4,768 | 0.3 | 0.3 |
0 / 13 |
0 | ||
| For the Poor | None | 2,667 | 0.2 | 0.1 |
0 / 13 |
0 | ||
| Blue and White Front | AENM | 1,176 | 0.1 | 0.1 |
0 / 13 |
0 | ||
| Kristiina Ilmarinen | None | 526 | 0.0 | 0 |
0 / 13 |
0 | ||
| Valid votes | 1,728,294 | 99.4 | ||||||
| Blank and invalid votes | 9,743 | 0.6 | ||||||
| Totals | 1,738,037 | 100.00 | — | 13 / 13 |
0 | |||
| Electorate (eligible voters) and voter turnout | 4,440,297 | 41.0 | 0.7 |
|||||
| Source: Ministry of Justice | ||||||||
MEPs elected

Largest party by municipality:
National Coalition Party
Centre Party
Finns Party
Social Democratic Party
Left Alliance
Swedish People's Party
Christian Democrats
- National Coalition Party
- Alexander Stubb* – 148,190 votes
- Sirpa Pietikäinen – 49,842 votes
- Henna Virkkunen – 43,829 votes
- Centre Party
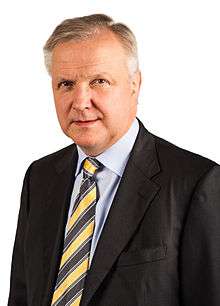
- Olli Rehn – 70,398 votes
- Paavo Väyrynen – 69,360 votes
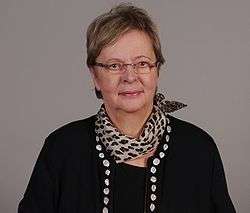
- Anneli Jäätteenmäki – 59,538 votes
- Finns Party
- Jussi Halla-aho – 80,772 votes
- Sampo Terho – 33,833 votes
- Social Democratic Party
- Liisa Jaakonsaari – 44,061 votes
- Miapetra Kumpula-Natri – 40,734 votes
- Green League
- Heidi Hautala – 31,725 votes
- Left Alliance
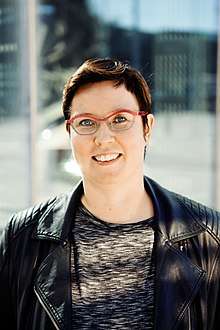
- Merja Kyllönen – 58,611 votes
- Swedish People's Party
- Nils Torvalds – 29,355 votes
* Note: Alexander Stubb was chosen to be National Coalition Party chairman in June, and was subsequently appointed Prime Minister. Stubb did not take his seat in the European Parliament. The seat went to Petri Sarvamaa, who had the fourth most votes (37,862) on the NCP list.[3]
Candidates receiving most personal votes
Opinion polling

Hustings panel for the European Parliament election in Haaga primary school, Helsinki, Finland, 15 April 2014. From left to right: Ozan Yanar (Greens), Jukka Mattila (panel moderator), Timo Harakka (Social Democratic Party), Marjatta Rasi (National Coalition Party).
| Date | Polling Firm | NCP | CEN | SDP | GREEN | FP | SPP | LEFT | CD | Others |
|---|---|---|---|---|---|---|---|---|---|---|
| 22 May 2014 | Taloustutkimus | 22.7% | 17.6% | 13.8% | 10.0% | 17.1% | 4.3% | 8.4% | 4.4% | 1.7% |
| 17 May 2014 | Tietoykkönen[5] | 23.7% | 18.9% | 15.2% | 8.1% | 16.0% | 4.1% | 7.7% | 4.4% | 1.9% |
| 20 March 2014 | Taloustutkimus | 23.8% | 18.1% | 16.3% | 9.7% | 17.8% | 3.6% | 6.5% | 2.6% | 1.6% |
| 17 January 2014 | Tietoykkönen | 21.1% | 20.8% | 17.5% | 8.9% | 15.9% | 4.1% | 7.2% | 3.3% | 1.2% |
| 19 November 2013 | Taloustutkimus | 22.7% | 21.7% | 15.4% | 8.1% | 17.0% | 3.5% | 7.1% | 3.6% | 0.9% |
| 7 June 2009 | Election Results | 23.21% | 19.03% | 17.54% | 12.40% | 9.79% | 6.09% | 5.93% | 4.17% | 1.84% |
gollark: bie.
gollark: Your ideas for logging are interesting though, and `print`/`term` log output will be considered for version ERROR.-04.
gollark: Because I am still an idiot, incident reports, which are much less common, go straight to my server.
gollark: <@151391317740486657> PotatOS logs all events in extended monitoring mode, but as I am not an idiot these are logged to your local computer and not my server directly.
gollark: ...
References
- "Results of the 2014 European elections – Results by country – Finland – European Parliament". Results of the 2014 European elections – Results by country – Finland – European Parliament.
- "Aikataulut – Vaalit.fi". vaalit.fi. Archived from the original on 2 February 2015.
- http://www.verkkouutiset.fi/politiikka/Petri%20Sarvamaa%20puoluekokouksessa%20video-22148
- "Koko maa - Ehdokkaat äänimääräjärjestyksessä". Eurovaalit 2014 - tulospalvelu - yle.fi.
- Iltalehti 17–18 May 2014, p. 2–3.
External links

This article is issued from Wikipedia. The text is licensed under Creative Commons - Attribution - Sharealike. Additional terms may apply for the media files.
_(cropped).jpg)

.jpg)


.jpg)