2003 Finnish parliamentary election
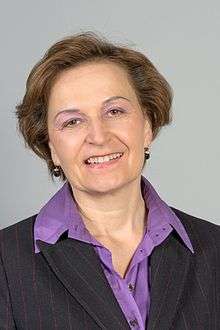
Parliamentary elections were held in Finland on 16 March 2003.[1] The Centre Party led by Anneli Jäätteenmäki overtook the Social Democratic Party (SDP) to become the largest party in the Eduskunta. This was credited mainly to Jäätteenmäki's powerful leadership and modernization of the party still often viewed as agrarian and conservative by many. However, the SDP actually won some seats and increased its share of the vote, losing in the number of total popular votes only by a few thousand.
| |||||||||||||||||||||||||||||||||||||||||||||||||||||||||||||||||||||||||||||||||||||||||||||||||||||||||||||||||||||||||||||||||
All 200 seats to the Parliament 101 seats were needed for a majority | |||||||||||||||||||||||||||||||||||||||||||||||||||||||||||||||||||||||||||||||||||||||||||||||||||||||||||||||||||||||||||||||||
|---|---|---|---|---|---|---|---|---|---|---|---|---|---|---|---|---|---|---|---|---|---|---|---|---|---|---|---|---|---|---|---|---|---|---|---|---|---|---|---|---|---|---|---|---|---|---|---|---|---|---|---|---|---|---|---|---|---|---|---|---|---|---|---|---|---|---|---|---|---|---|---|---|---|---|---|---|---|---|---|---|---|---|---|---|---|---|---|---|---|---|---|---|---|---|---|---|---|---|---|---|---|---|---|---|---|---|---|---|---|---|---|---|---|---|---|---|---|---|---|---|---|---|---|---|---|---|---|---|---|
| Turnout | 66.7% | ||||||||||||||||||||||||||||||||||||||||||||||||||||||||||||||||||||||||||||||||||||||||||||||||||||||||||||||||||||||||||||||||
| |||||||||||||||||||||||||||||||||||||||||||||||||||||||||||||||||||||||||||||||||||||||||||||||||||||||||||||||||||||||||||||||||
| |||||||||||||||||||||||||||||||||||||||||||||||||||||||||||||||||||||||||||||||||||||||||||||||||||||||||||||||||||||||||||||||||
 |
|---|
| This article is part of a series on the politics and government of Finland |
|
Executive
|
|
Legislative |
|
|
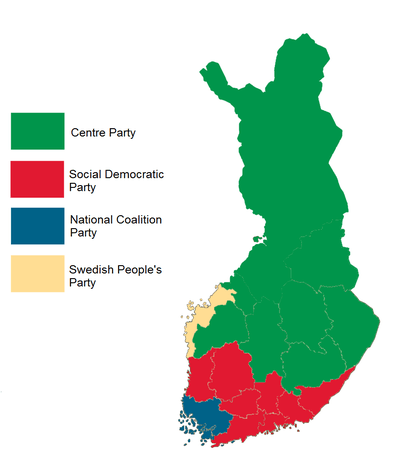
The Green League achieved its best results ever, but the Swedish People's Party suffered losses. The Christian Democrats gained votes but lost seats. This was partly because in 1999 and before Christian Democrats had been in an election coalition with Centre Party and benefited from this, while the Centre Party had lost seats due to the arrangement, and thus discontinued it starting from 2003. The Left Alliance continued its slow decline, while the small populist Finns Party did not do as well as some had expected.
Electoral system
The election was held under the d'Hondt method of party-list proportional representation, where the electoral district voted directly for the individual candidate, but each vote also benefitted the candidate's party.
The country was divided into fifteen electoral districts, with the boundaries corresponding to those of administrative regions (in some cases several regions have been grouped into a single constituency), with the exception that the city of Helsinki serves as its own constituency, instead of being part of the Uusimaa region in this case. Each constituency elected a number of representatives to the Eduskunta based on its population. The autonomous region of Åland had a special status with one representative even if its population was not large enough.
Candidates for the parliamentary election were allowed to be set by political parties and electoral associations. Any Finnish citizen over the age of 18 was eligible for candidacy, apart from incapacitated persons and professional soldiers. Each party or electoral union was allowed to set a maximum of 14 candidates per electoral district, or, in the case the district elected more than 14 members of parliament, an amount equal to that of the representatives elected.
Each Finnish citizen aged 18 or over on the election day had the right to vote in the election, no matter where they lived. The electorate consisted of a total of 4,220,951 people, 4,015,552 of whom were resident in Finland and 205,399 abroad.
Results
| Party | Votes | % | Seats | +/– | |
|---|---|---|---|---|---|
| Centre Party | 689,391 | 24.7 | 55 | +7 | |
| Social Democratic Party | 683,223 | 24.5 | 53 | +2 | |
| National Coalition Party | 517,904 | 18.6 | 40 | –6 | |
| Left Alliance | 277,152 | 9.9 | 19 | –1 | |
| Green League | 223,564 | 8.0 | 14 | +3 | |
| Christian Democrats | 148,987 | 5.3 | 7 | –3 | |
| Swedish People's Party | 128,824 | 4.6 | 8 | –3 | |
| Finns Party | 43,816 | 1.6 | 3 | +2 | |
| Communist Party of Finland | 21,079 | 0.8 | 0 | 0 | |
| Forces for Change in Finland | 11,485 | 0.4 | 0 | New | |
| Liberals | 8,776 | 0.3 | 0 | 0 | |
| Kirjava ”Puolue” – Elonkehän Puolesta | 6,659 | 0.2 | 0 | 0 | |
| Pensioners for People | 5,346 | 0.2 | 0 | 0 | |
| Finnish People's Blue-Whites | 4,579 | 0.2 | 0 | New | |
| Åland Coalition | 4,306 | 0.2 | 1 | 0 | |
| Communist Workers' Party – For Peace and Socialism | 2,908 | 0.1 | 0 | 0 | |
| Finland Rises – People Unites | 2,640 | 0.1 | 0 | New | |
| For the Poor | 1,448 | 0.1 | 0 | New | |
| Joint Responsibility Party | 404 | 0.0 | 0 | New | |
| Others | 9,266 | 0.3 | 0 | – | |
| Invalid/blank votes | 23,943 | – | – | – | |
| Total | 2,815,700 | 100 | 200 | 0 | |
| Registered voters/turnout | 4,220,951 | 66.7 | – | – | |
| Source: Tilastokeskus[2] | |||||
By province
| Province | Centre Party | Social Democratic Party | National Coalition Party | Left Alliance | Green League | Christian League | Swedish People's Party | True Finns | Communist | Electorate | Votes | Valid votes | Invalid votes |
|---|---|---|---|---|---|---|---|---|---|---|---|---|---|
| Southern Savonia | 34,205 | 27,030 | 11,283 | 2,282 | 3,410 | 4,810 | 0 | 472 | 417 | 130,103 | 85,077 | 84,520 | 780 |
| Northern Savonia | 49,301 | 26,906 | 15,425 | 15,429 | 7,399 | 12,093 | 0 | 851 | 1,106 | 197,514 | 129,585 | 129,081 | 906 |
| North Karelia | 33,026 | 30,639 | 8,498 | 4,326 | 5,767 | 3,798 | 0 | 635 | 837 | 132,484 | 88,225 | 87,824 | 666 |
| Kainuu | 22,756 | 5,217 | 3,201 | 10,142 | 1,063 | 1,731 | 41 | 222 | 291 | 68,445 | 45,093 | 44,958 | 313 |
| Uusimaa | 81,039 | 181,363 | 176,712 | 61,089 | 103,523 | 25,944 | 54,262 | 22,277 | 4,021 | 1,005,079 | 725,654 | 725,657 | 6,514 |
| Eastern Uusimaa | 6,037 | 12,459 | 6,041 | 2,802 | 3,285 | 1,198 | 14,977 | 328 | 159 | 68,350 | 48,491 | 48,304 | 455 |
| Southwest Finland | 43,552 | 61,367 | 64,823 | 26,515 | 21,250 | 9,597 | 13,081 | 845 | 1,615 | 351,346 | 248,253 | 248,369 | 1,995 |
| Tavastia Proper | 17,295 | 30,035 | 18,466 | 7,716 | 5,165 | 7,429 | 0 | 313 | 796 | 129,357 | 89,575 | 88,830 | 986 |
| Päijänne Tavastia | 17,464 | 30,254 | 22,671 | 9,044 | 6,251 | 10,996 | 0 | 605 | 749 | 154,705 | 100,639 | 100,024 | 1,022 |
| Kymenlaakso | 22,245 | 33,398 | 20,862 | 9,788 | 4,907 | 4,888 | 0 | 320 | 650 | 147,186 | 98,669 | 97,982 | 1,061 |
| South Karelia | 21,882 | 26,169 | 14,050 | 2,166 | 2,860 | 4,550 | 0 | 393 | 485 | 108,192 | 73,807 | 73,351 | 720 |
| Central Finland | 48,532 | 35,480 | 19,730 | 13,199 | 9,027 | 10,278 | 0 | 510 | 1,678 | 206,066 | 139,519 | 139,024 | 1,158 |
| Southern Ostrobothnia | 56,649 | 14,857 | 17,614 | 3,383 | 2,551 | 5,848 | 204 | 7,890 | 164 | 150,030 | 110,304 | 110,189 | 581 |
| Ostrobothnia | 9,348 | 17,670 | 8,987 | 5,597 | 2,574 | 8,542 | 42,889 | 1,491 | 275 | 132,208 | 97,508 | 97,794 | 734 |
| Satakunta | 36,238 | 38,369 | 21,662 | 19,330 | 4,492 | 5,908 | 0 | 1,926 | 280 | 186,492 | 129,822 | 129,087 | 1,166 |
| Pirkanmaa | 40,957 | 63,382 | 56,443 | 30,979 | 24,050 | 14,991 | 0 | 1,220 | 5,430 | 355,780 | 248,165 | 247,229 | 1,968 |
| Central Ostrobothnia | 17,589 | 6,512 | 1,882 | 1,836 | 824 | 4,941 | 2,837 | 1,858 | 216 | 53,322 | 38,683 | 38,656 | 306 |
| Northern Ostrobothnia | 85,580 | 27,384 | 19,148 | 25,462 | 13,014 | 10,601 | 312 | 1,496 | 1,571 | 274,057 | 187,443 | 187,297 | 1,377 |
| Lapland | 45,696 | 14,732 | 10,406 | 26,067 | 2,152 | 844 | 221 | 164 | 339 | 145,397 | 101,369 | 101,930 | 936 |
| Åland Islands | 0 | 0 | 0 | 0 | 0 | 0 | 0 | 0 | 0 | 19,439 | 11,715 | 11,651 | 299 |
| Source: European Election Database | |||||||||||||
Aftermath
The Council of State, or the Finnish cabinet, was formed after the parliamentary election by the Centre Party, with its leader Anneli Jäätteenmäki as Prime Minister. A coalition government was formed, composing of the two largest parties of the Eduskunta, the Social Democratic Party (SDP) and the Centre Party, and a minor coalition partner, the Swedish People's Party, who has a history of being a partner in government since 1976. The new cabinet had eight ministers from both the SDP and the Centre Party, and two ministers from the Swedish People's Party.
However, this proved to be one of the shortest-lived cabinets in Finnish history, lasting only 69 days, after the Iraq leak scandal led to the government falling on 24 June 2003. A new cabinet was formed by the Centre Party's Matti Vanhanen, with largely the same composition as the previous cabinet.
Further reading
- Arter, David (July 2003). "From the 'rainbow coalition' back down to 'red earth'? the 2003 finnish general election". West European Politics. 26 (3): 153–162. doi:10.1080/01402380312331280628.
References
- Nohlen, D & Stöver, P (2010) Elections in Europe: A data handbook, p606 ISBN 978-3-8329-5609-7
- Eduskuntavaalit 1927–2003 Tilastokeskus 2004
External links
- Parliamentary Elections at the Finnish Ministry of Justice's website. (Web Archive)
