2009 European Parliament election in Portugal
The European Parliament election of 2009 in Portugal was the election of the delegation from Portugal to the European Parliament held on 7 June 2009.
| |||||||||||||||||||||||||||||||||||||||||||||||||||||||||||||||||||||||||||
24 seats to the European Parliament | |||||||||||||||||||||||||||||||||||||||||||||||||||||||||||||||||||||||||||
|---|---|---|---|---|---|---|---|---|---|---|---|---|---|---|---|---|---|---|---|---|---|---|---|---|---|---|---|---|---|---|---|---|---|---|---|---|---|---|---|---|---|---|---|---|---|---|---|---|---|---|---|---|---|---|---|---|---|---|---|---|---|---|---|---|---|---|---|---|---|---|---|---|---|---|---|
| Turnout | 36.8% | ||||||||||||||||||||||||||||||||||||||||||||||||||||||||||||||||||||||||||
| |||||||||||||||||||||||||||||||||||||||||||||||||||||||||||||||||||||||||||
The election was a huge setback for the Socialist Party (PS), which lost almost 18 percentage points. Basically all predictions that said that the PS would win comfortably the election, were wrong. As a result, the party also lost five of its twelve MEP's. The Social Democrats (PSD) were the big winners in these elections, surprising pundits and analysts who predicted a very complicated result for the PSD leader, Manuela Ferreira Leite. The PSD won 31.7% of the vote and 8 seats. It was the first victory of the PSD, in European elections, since 1989. The People's Party (CDS-PP) also had a surprising result, winning 8% of the vote and electing 2 MEP's. Both PSD and CDS-PP, who ran in a joint list in 2004, increased sharply their scores and together they won more than 40% of the vote and 10 MEP's.
On the left, both the Left Bloc (BE) and Democratic Unity Coalition (CDU) achieved very good results with the historic fact that BE surpassed CDU in term of votes and seats for the first time, although only just. Both parties increased their scores at the expense of the Socialist Party. The Left Bloc won 10.7% of the vote and 3 MEP's, their best score in EU elections to date, and CDU surpassed once again the 10% mark winning 10.6% of the vote, but maintaining the 2 MEP they got in 2004.
Turnout in the elections was quite low, as only 36.78% of the electorate cast a ballot, a slightly lower share than in the 2004 election. Although the number of ballots cast was higher than in 2004, the number of registered voters increased considerably in these elections, making the final turnout share lower than in 2004.
Electoral System
The voting method used, for the election of European members of parliament, is by proportional representation using the d'Hondt method, which is known to benefit leading parties. In the 2009 EU elections, Portugal had 22 seats to be filled. Deputies are elected in a single constituency, corresponding to the entire national territory.
Parties and candidates
The lists were headed by[1]
- Socialist Party (Partido Socialista, PS): Vital Moreira
- Social Democratic Party (Partido Social Democrata, PSD): Paulo Rangel
- Democratic Unity Coalition (Coligação Democrática Unitária, CDU): Ilda Figueiredo
- CDS – People's Party (CDS – Partido Popular, CDS–PP): Nuno Melo
- Left Bloc (Bloco de Esquerda, BE): Miguel Portas
- Portuguese Workers' Communist Party/Reorganized Movement of the Party of the Proletariat (Partido Comunista dos Trabalhadores Portugueses / Movimento Reorganizativo do Partido do Proletariado, PCTP/MRPP): Orlando Alves
- Earth Party (Partido da Terra, MPT): Pedro Quartin Graça
- Hope for Portugal Movement (Movimento Esperança Portugal, MEP): Laurinda Alves
- People's Monarchist Party (Partido Popular Monárquico, PPM): Frederico Carvalho
- Merit and Society Movement (Movimento Mérito e Sociedade, MMS): Carlos Gomes
- National Renovator Party (Partido Nacional Renovador, PNR): Humberto Nuno de Oliveira
- Humanist Party (Partido Humanista, PH): Manuela Magno
- Workers Party of Socialist Unity (Partido Operário de Unidade Socialista, POUS): Carmelinda Pereira
Opinion Polling and preliminary exit polls
Exit polls from the three major television networks in Portugal, RTP1, SIC and TVI were given precisely at 20:00 pm (local time) on 7 June 2009.
| Date Released | Polling Firm | PS | PSD | CDS-PP | CDU | BE | Others | Lead | |
|---|---|---|---|---|---|---|---|---|---|
| 7 June 2009 | Election Results | 26.5 7 seats |
31.7 8 seats |
8.4 2 seats |
10.6 2 seats |
10.7 3 seats |
12.1 | 5.2 | |
| 7 June 2009 | Exit Poll – RTP1 Universidade Católica |
28.0–33.0 7 / 8 |
29.0–34.0 8 / 9 |
7.0–10.0 2 |
9.0–12.0 2 / 3 |
9.0–12.0 2 |
1.0 | ||
| 7 June 2009 | Exit Poll – SIC Eurosondagem |
27.7–31.5 7 / 8 |
29.2–33.0 7 / 8 |
7.5–9.3 2 |
9.5– 11.3 2 / 3 |
11.6–13.4 3 |
1.5 | ||
| 7 June 2009 | Exit Poll – TVI INTERCAMPUS |
24.1–28.1 6 / 8 |
30.4–34.4 8 / 9 |
6.7– 9.3 1 / 2 |
9.7–12.7 2 / 3 |
9.8–12.8 2 / 3 |
6.3 | ||
| Exit polls | |||||||||
| 5 June 2009 | Universidade Católica | 34.0 | 32.0 | 4.0 | 11.0 | 9.0 | 10.0 | 2.0 | |
| 5 June 2009 | Eurosondagem | 36.0 | 31.9 | 6.1 | 9.0 | 10.1 | 6.9 | 4.1 | |
| 4 June 2009 | Aximage | 36.2 | 30.9 | 5.0 | 10.1 | 10.2 | 7.6 | 5.3 | |
| 4 June 2009 | Marktest | 29.4 | 32.5 | 3.3 | 8.9 | 8.9 | 17.0 | 3.1 | |
| 1 June 2009 | Marktest | 31.9 | 30.1 | 4.7 | 7.1 | 7.1 | 19.1 | 1.8 | |
| 29 May 2009 | Eurosondagem | 35.5 | 32.5 | 6.5 | 9.2 | 8.8 | 7.5 | 3.0 | |
| 22 May 2009 | Eurosondagem | 34.3 | 32.1 | 6.9 | 8.9 | 10.1 | 7.7 | 2.2 | |
| 9 May 2009 | Marktest | 33.1 | 32.9 | 4.5 | 7.6 | 8.4 | 13.5 | 0.2 | |
| 1 May 2009 | Universidade Católica | 39.0 | 36.0 | 4.0 | 7.0 | 12.0 | 2.0 | 3.0 | |
| 24 April 2009 | INTERCAMPUS | 34.0 | 33.5 | 6.9 | 7.9 | 18.0 | N/A | 0.5 | |
| 13 June 2004 | Election Results | 44.5 12 seats |
33.3 9 seats |
9.1 2 seats |
4.9 1 seats |
8.2 | 11.2 | ||
Results
| ← 2004 • 2009 • 2014 → | ||||||||||
| National party | European party | Main candidate | Votes | % | +/– | Seats | +/– | |||
|---|---|---|---|---|---|---|---|---|---|---|
| Social Democratic Party (PSD) | EPP | Paulo Rangel | 1,131,744 | 31.71 | [lower-alpha 1] | 8 | * 1 | |||
| Socialist Party (PS) | PES | Vital Moreira | 946,818 | 26.53 | 17.99 |
7 | 5 | |||
| Left Bloc (BE) | EACL / PEL | Miguel Portas | 382,667 | 10.72 | 5.81 |
3 | 2 | |||
| Democratic Unitarian Coalition (CDU) • Communist Party (PCP) • Ecologist Party (PEV) |
GUE/NGL | Ilda Figueiredo | 379,787 | 10.64 | 1.55 |
2 2 0 |
0 0 | |||
| People's Party (CDS–PP) | EPP | Nuno Melo | 298,423 | 8.36 | [lower-alpha 1] | 2 | * 0 | |||
| Hope for Portugal Movement (MEP) | None | Laurinda Alves | 55,072 | 1.54 | new | 0 | 0 | |||
| Workers' Communist Party (PCTP/MRPP) | None | Orlando Alves | 42,940 | 1.20 | 0.13 |
0 | 0 | |||
| Others (parties or candidates that won less than 1% of the vote and no seats) | 95,744 | 2.69 | — | 0 | 0 | |||||
| Valid votes | 3,333,195 | 93.39 | ||||||||
| Blank and invalid votes | 235,748 | 6.61 | ||||||||
| Totals | 3,568,943 | 100.00 | — | 22 | 2 | |||||
| Electorate (eligible voters) and voter turnout | 9,704,559 | 36.78 | 1.82 |
|||||||
| Source: Comissão Nacional de Eleições | ||||||||||
Distribution by European group
| Groups | Parties | Seats | Total | % | |
|---|---|---|---|---|---|
| European People's Party (EPP) |
|
8 2 |
10 | 45.45 | |
| Party of European Socialists (PES) |
|
7 | 7 | 31.82 | |
| European United Left–Nordic Green Left (GUE/NGL) |
|
3 2 |
5 | 22.73 | |
| Total | 22 | 22 | 100.00 | ||
Maps
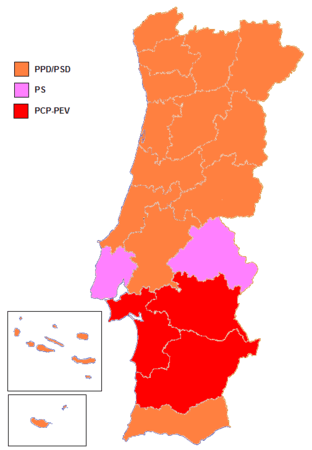
 Most voted party by district and autonomous region.
.png) Strongest party by municipality.
Strongest party by municipality.
See also
Notes
- The Social Democratic Party and the People's Party contested, together, the 2004 election in a coalition (Forward Portugal).
References
- "Lista de candidatos ao PE 2009 / Candidate list for EP 2009" (PDF). Retrieved 4 June 2009.
- "Elecciones al Parlamento Europeo: Resultados por países 1979 - 2014". historiaelectoral.com (in Spanish). Retrieved 28 November 2017.
_(cropped).jpg)

.jpg)
.jpg)
