1994 California Attorney General election
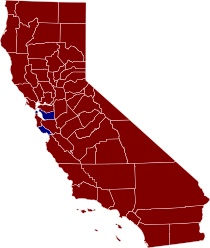
The 1994 California Attorney General election occurred on November 8, 1994. The primary elections took place on March 8, 1994. The Republican incumbent, Dan Lungren, easily defeated the Democratic nominee, Assemblyman Tom Umberg. Every candidate in this race was unopposed in the primary.[1] As of 2020, this is the last time a Republican was elected Attorney General of California.
| |||||||||||||||||
| |||||||||||||||||
 Election results by county | |||||||||||||||||
| |||||||||||||||||
Election results
Final results from the Secretary of State of California.[2]
| Party | Candidate | Votes | % | |
|---|---|---|---|---|
| Republican | Dan Lungren (incumbent) | 4,438,733 | 53.86 | |
| Democratic | Tom Umberg | 3,256,070 | 39.51 | |
| Libertarian | Richard N. Burns | 274,335 | 3.33 | |
| Peace and Freedom | Robert J. Evans | 271,459 | 3.29 | |
| Invalid or blank votes | 660,039 | 7.42 | ||
| Total votes | 8,240,597 | 100.00 | ||
| Turnout | 46.98 | |||
| Republican hold | ||||
Results by county
Results from the Secretary of State of California:
| County | Lungren | Votes | Umberg | Votes | Burns | Votes | Evans | Votes |
|---|---|---|---|---|---|---|---|---|
| Sutter | 71.15% | 15,380 | 23.80% | 5,144 | 2.48% | 536 | 2.57% | 555 |
| Colusa | 69.71% | 3,395 | 25.65% | 1,249 | 2.75% | 134 | 1.89% | 92 |
| Placer | 68.06% | 50,220 | 26.60% | 19,626 | 3.26% | 2,405 | 2.08% | 1,534 |
| El Dorado | 66.94% | 35,636 | 26.88% | 14,309 | 3.80% | 2,025 | 2.37% | 1,262 |
| Inyo | 66.90% | 4,680 | 27.02% | 1,890 | 3.29% | 230 | 2.79% | 195 |
| Madera | 66.71% | 17,241 | 28.00% | 7,238 | 2.53% | 654 | 2.76% | 713 |
| Glenn | 65.71% | 5,088 | 29.19% | 2,260 | 2.49% | 193 | 2.61% | 202 |
| Nevada | 65.15% | 24,165 | 27.64% | 10,252 | 4.39% | 1,629 | 2.81% | 1,043 |
| Amador | 64.91% | 8,401 | 29.75% | 3,850 | 3.18% | 411 | 2.16% | 280 |
| Tulare | 64.90% | 48,669 | 29.21% | 21,900 | 2.51% | 1,885 | 3.38% | 2,531 |
| Tuolumne | 64.10% | 12,435 | 30.18% | 5,855 | 3.28% | 636 | 2.44% | 473 |
| Fresno | 63.66% | 110,038 | 31.19% | 53,905 | 2.44% | 4,222 | 2.71% | 4,676 |
| Calaveras | 63.60% | 9,796 | 29.60% | 4,559 | 4.20% | 647 | 2.60% | 401 |
| Mariposa | 63.28% | 4,383 | 29.34% | 2,032 | 3.75% | 260 | 3.62% | 251 |
| Kern | 63.03% | 91,625 | 30.58% | 44,451 | 3.30% | 4,799 | 3.10% | 4,502 |
| Shasta | 62.99% | 33,887 | 30.38% | 16,345 | 3.69% | 1,987 | 2.94% | 1,579 |
| Yuba | 62.92% | 8,661 | 29.53% | 4,065 | 3.97% | 547 | 3.57% | 492 |
| Modoc | 62.45% | 2,337 | 28.25% | 1,057 | 5.05% | 189 | 4.25% | 159 |
| Orange | 62.29% | 451,701 | 32.52% | 235,852 | 3.12% | 22,602 | 2.07% | 14,988 |
| Plumas | 62.24% | 5,104 | 30.46% | 2,498 | 4.29% | 352 | 3.00% | 246 |
| Sierra | 61.92% | 974 | 29.05% | 457 | 5.59% | 88 | 3.43% | 54 |
| Mono | 61.59% | 2,059 | 30.18% | 1,009 | 5.06% | 169 | 3.17% | 106 |
| Kings | 61.50% | 13,437 | 33.17% | 7,247 | 2.34% | 512 | 2.99% | 653 |
| Stanislaus | 61.30% | 59,610 | 33.30% | 32,380 | 2.57% | 2,497 | 2.83% | 2,754 |
| Sacramento | 61.04% | 211,825 | 33.21% | 115,250 | 2.99% | 10,373 | 2.75% | 9,552 |
| San Joaquin | 60.83% | 74,634 | 34.29% | 42,063 | 2.38% | 2,919 | 2.50% | 3,069 |
| Riverside | 60.52% | 199,134 | 33.66% | 110,742 | 3.05% | 10,036 | 2.77% | 9,128 |
| Butte | 60.38% | 39,981 | 33.03% | 21,868 | 3.53% | 2,337 | 3.06% | 2,028 |
| Siskiyou | 60.28% | 10,601 | 31.46% | 5,532 | 4.61% | 811 | 3.65% | 642 |
| San Diego | 60.02% | 427,643 | 33.57% | 239,167 | 3.58% | 25,477 | 2.84% | 20,236 |
| Lassen | 59.63% | 4,732 | 31.14% | 2,471 | 5.57% | 442 | 3.67% | 291 |
| Merced | 59.37% | 22,723 | 35.40% | 13,548 | 2.50% | 958 | 2.73% | 1,043 |
| Ventura | 59.19% | 122,779 | 34.50% | 71,566 | 3.40% | 7,053 | 2.92% | 6,048 |
| San Bernardino | 58.79% | 196,938 | 34.75% | 116,406 | 3.26% | 10,920 | 3.20% | 10,705 |
| Tehama | 57.21% | 10,344 | 35.47% | 6,413 | 4.28% | 773 | 3.05% | 551 |
| Alpine | 56.71% | 359 | 31.60% | 200 | 7.11% | 45 | 4.58% | 29 |
| Lake | 55.40% | 10,594 | 37.63% | 7,196 | 3.64% | 697 | 3.33% | 637 |
| Del Norte | 54.92% | 3,992 | 37.65% | 2,737 | 4.20% | 305 | 3.23% | 235 |
| San Luis Obispo | 54.63% | 45,413 | 38.62% | 32,108 | 3.59% | 2,985 | 3.16% | 2,629 |
| Trinity | 54.48% | 2,877 | 33.31% | 1,759 | 6.85% | 362 | 5.36% | 283 |
| Napa | 53.84% | 22,117 | 39.58% | 16,259 | 3.55% | 1,458 | 3.03% | 1,246 |
| Santa Barbara | 52.78% | 65,705 | 40.39% | 50,285 | 3.35% | 4,174 | 3.47% | 4,326 |
| Contra Costa | 52.02% | 145,237 | 41.53% | 115,942 | 3.30% | 9,211 | 3.15% | 8,802 |
| Solano | 51.90% | 49,601 | 41.52% | 39,688 | 3.29% | 3,147 | 3.29% | 3,143 |
| Sonoma | 51.69% | 78,895 | 39.01% | 59,541 | 4.32% | 6,591 | 4.98% | 7,601 |
| Imperial | 50.57% | 11,579 | 41.12% | 9,417 | 3.52% | 805 | 4.79% | 1,098 |
| Yolo | 50.25% | 23,794 | 42.45% | 20,099 | 3.55% | 1,679 | 3.76% | 1,779 |
| Monterey | 49.68% | 43,855 | 43.73% | 38,602 | 3.24% | 2,859 | 3.35% | 2,960 |
| San Benito | 49.64% | 5,569 | 43.20% | 4,847 | 3.58% | 402 | 3.57% | 401 |
| Santa Clara | 49.18% | 206,729 | 42.74% | 179,637 | 4.38% | 18,423 | 3.70% | 15,541 |
| Los Angeles | 48.44% | 955,926 | 45.27% | 893,410 | 2.99% | 58,929 | 3.30% | 65,151 |
| Mendocino | 48.36% | 13,872 | 38.91% | 11,161 | 5.31% | 1,522 | 7.42% | 2,128 |
| San Mateo | 47.78% | 97,629 | 45.40% | 92,753 | 3.50% | 7,149 | 3.32% | 6,785 |
| Humboldt | 46.79% | 21,522 | 42.44% | 19,518 | 4.64% | 2,133 | 6.14% | 2,822 |
| Marin | 46.55% | 46,678 | 45.78% | 45,909 | 3.76% | 3,771 | 3.91% | 3,921 |
| Santa Cruz | 39.98% | 34,362 | 47.52% | 40,843 | 5.82% | 5,000 | 6.69% | 5,751 |
| Alameda | 38.23% | 144,754 | 53.83% | 203,850 | 3.38% | 12,799 | 4.56% | 17,285 |
| San Francisco | 31.31% | 67,418 | 58.45% | 125,853 | 3.80% | 8,181 | 6.44% | 13,872 |
gollark: You could give me access to it.
gollark: It's bad compared to the amazingly powerful osmarksdevices™.
gollark: Basically, a company puts a lot of big computers in a room somewhere, and then cuts them up, and rents the pieces to people like you, LyricLy of Macron.
gollark: You would probably use one to host esobot, if you didn't run it on some bad laptop.
gollark: Well, a VPS is a "virtual private server".
See also
- California state elections, 1994
- California Attorney General
- List of Attorneys General of California
References
- "CA Secretary of State - Statement of Vote - 1994 Primary Election". Archived from the original on 2008-07-04. Retrieved 2008-08-12.
- "CA Secretary of State - Statement of Votes - 1994 General Election" (PDF). Archived from the original (PDF) on 2008-07-30. Retrieved 2008-08-12.
External links
This article is issued from Wikipedia. The text is licensed under Creative Commons - Attribution - Sharealike. Additional terms may apply for the media files.
.jpg)
_(1).jpg)
