1976 United States presidential election in Ohio
The 1976 United States presidential election in Ohio took place on November 2, 1976. All 50 states and the District of Columbia were part of the 1976 United States presidential election. State voters chose 25 electors to the Electoral College, who voted for president and vice president.
| ||||||||||||||||||||||||||
| ||||||||||||||||||||||||||
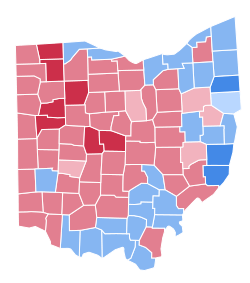 County Results
| ||||||||||||||||||||||||||
| ||||||||||||||||||||||||||
.jpg)
| Elections in Ohio | ||||||||||||||||||||
|---|---|---|---|---|---|---|---|---|---|---|---|---|---|---|---|---|---|---|---|---|
.svg.png) | ||||||||||||||||||||
|
||||||||||||||||||||
|
||||||||||||||||||||
|
|
||||||||||||||||||||
|
||||||||||||||||||||
|
|
||||||||||||||||||||
Ohio was won by former Georgia Governor Jimmy Carter (D) by a margin of 0.27%. As of the 2016 presidential election, this is the last election in which Adams County and Brown County voted for a Democratic presidential candidate, and the last time Wood County voted for a losing candidate.[1]
The state was not only one of the closest states in the election, but it was called for Carter after he won Wisconsin, the tipping-point state of the election. This being said, even if Ford carried the state, Carter would still have retained 272 electoral votes, enough to win the presidency.[2] [3]
Results
| 1976 United States presidential election in Ohio[4] | ||||||
|---|---|---|---|---|---|---|
| Party | Candidate | Running mate | Votes | Percentage | Electoral votes | |
| Democratic | Jimmy Carter | Walter Mondale | 2,011,621 | 48.92% | 25 | |
| Republican | Gerald Ford | Bob Dole | 2,000,505 | 48.65% | 0 | |
| Not Designated | Eugene McCarthy | Dennis Anderson | 58,258 | 1.42% | 0 | |
| American | Lester Maddox | William Dyke | 15,529 | 0.38% | 0 | |
| Not Designated | Roger MacBride | David Bergland | 8,961 | 0.22% | 0 | |
| Not Designated | Gus Hall | Jarvis Tyner | 7,817 | 0.19% | 0 | |
| Not Designated | Peter Camejo | Willie Mae Reed | 4,717 | 0.11% | 0 | |
| Not Designated | Lyndon LaRouche | R. Wayne Evans | 4,335 | 0.11% | 0 | |
| Write-in | Julius Levin | Constance Blomen | 68 | 0.00% | 0 | |
| Write-in | Benjamin Bubar | Earl Dodge | 62 | 0.00% | 0 | |
| Totals | 4,107,408 | 100.00% | 9 | |||
Results by county
| County | James Earl Carter Democratic |
Gerald Rudolph Ford Republican |
Eugene Joseph McCarthy[5] Not Designated |
Lester Garfield Maddox[5] American |
Various candidates[5] Other parties |
Margin | Total votes cast[6] | ||||||
|---|---|---|---|---|---|---|---|---|---|---|---|---|---|
| # | % | # | % | # | % | # | % | # | % | # | % | ||
| Adams | 4,450 | 50.68% | 4,197 | 47.80% | 55 | 0.63% | 47 | 0.54% | 20 | 0.23% | 253 | 2.88% | 8,780 |
| Allen | 14,627 | 37.35% | 23,721 | 60.56% | 478 | 1.22% | 201 | 0.51% | 71 | 0.18% | -9,094 | -23.22% | 39,167 |
| Ashland | 7,205 | 41.52% | 9,761 | 56.25% | 256 | 1.48% | 71 | 0.41% | 28 | 0.16% | -2,556 | -14.73% | 17,354 |
| Ashtabula | 20,883 | 54.07% | 16,885 | 43.72% | 595 | 1.54% | 137 | 0.36% | 59 | 0.15% | 3,998 | 10.35% | 38,625 |
| Athens | 9,896 | 52.04% | 8,387 | 44.10% | 581 | 3.06% | 24 | 0.13% | 82 | 0.43% | 1,509 | 7.94% | 19,016 |
| Auglaize | 5,840 | 36.58% | 9,772 | 61.21% | 205 | 1.29% | 99 | 0.62% | 20 | 0.13% | -3,932 | -24.63% | 15,965 |
| Belmont | 21,162 | 60.09% | 13,550 | 38.47% | 305 | 0.87% | 72 | 0.20% | 86 | 0.24% | 7,612 | 21.61% | 35,219 |
| Brown | 5,432 | 53.64% | 4,549 | 44.92% | 87 | 0.86% | 37 | 0.37% | 10 | 0.10% | 883 | 8.72% | 10,126 |
| Butler | 35,123 | 40.74% | 49,625 | 57.56% | 817 | 0.95% | 286 | 0.33% | 236 | 0.27% | -14,502 | -16.82% | 86,217 |
| Carroll | 5,006 | 48.48% | 5,091 | 49.31% | 113 | 1.10% | 72 | 0.70% | 21 | 0.20% | -85 | -0.82% | 10,325 |
| Champaign | 4,748 | 41.28% | 6,526 | 56.74% | 135 | 1.18% | 48 | 0.42% | 28 | 0.24% | -1,778 | -15.46% | 11,502 |
| Clark | 26,135 | 47.81% | 26,745 | 48.93% | 699 | 1.28% | 253 | 0.46% | 614 | 1.13% | -610 | -1.12% | 54,660 |
| Clermont | 14,850 | 42.38% | 19,616 | 55.99% | 335 | 0.96% | 125 | 0.36% | 51 | 0.15% | -4,766 | -13.60% | 35,037 |
| Clinton | 4,959 | 42.25% | 6,597 | 56.21% | 115 | 0.98% | 25 | 0.21% | 28 | 0.24% | -1,638 | -13.96% | 11,737 |
| Columbiana | 23,096 | 49.81% | 22,318 | 48.13% | 606 | 1.31% | 221 | 0.48% | 70 | 0.15% | 778 | 1.68% | 46,367 |
| Coshocton | 5,827 | 46.63% | 6,361 | 50.90% | 143 | 1.15% | 51 | 0.41% | 97 | 0.78% | -534 | -4.27% | 12,496 |
| Crawford | 7,553 | 40.03% | 10,801 | 57.24% | 311 | 1.65% | 153 | 0.81% | 19 | 0.10% | -3,248 | -17.21% | 18,870 |
| Cuyahoga | 349,186 | 56.03% | 255,594 | 41.01% | 10,854 | 1.75% | 2,270 | 0.37% | 3,741 | 0.60% | 93,592 | 15.02% | 623,222 |
| Darke | 9,901 | 45.10% | 11,580 | 52.75% | 250 | 1.14% | 136 | 0.62% | 57 | 0.26% | -1,679 | -7.65% | 21,953 |
| Defiance | 5,850 | 42.77% | 7,526 | 55.02% | 188 | 1.38% | 63 | 0.46% | 29 | 0.21% | -1,676 | -12.25% | 13,679 |
| Delaware | 7,058 | 35.55% | 12,285 | 61.88% | 323 | 1.63% | 121 | 0.61% | 19 | 0.10% | -5,227 | -26.33% | 19,853 |
| Erie | 13,843 | 46.96% | 14,742 | 50.01% | 472 | 1.61% | 229 | 0.78% | 108 | 0.37% | -899 | -3.05% | 29,478 |
| Fairfield | 13,361 | 40.39% | 19,098 | 57.73% | 334 | 1.01% | 169 | 0.51% | 58 | 0.18% | -5,737 | -17.34% | 33,079 |
| Fayette | 4,477 | 43.20% | 5,719 | 55.18% | 76 | 0.73% | 64 | 0.62% | 13 | 0.13% | -1,242 | -11.98% | 10,364 |
| Franklin | 141,624 | 41.57% | 189,645 | 55.66% | 6,062 | 1.78% | 1,187 | 0.35% | 1,161 | 0.34% | -48,021 | -14.09% | 340,712 |
| Fulton | 4,850 | 37.45% | 7,891 | 60.94% | 167 | 1.29% | 24 | 0.19% | 7 | 0.05% | -3,041 | -23.48% | 12,949 |
| Gallia | 4,971 | 48.18% | 5,198 | 50.38% | 91 | 0.88% | 36 | 0.35% | 15 | 0.15% | -227 | -2.20% | 10,317 |
| Geauga | 10,449 | 39.78% | 15,004 | 57.12% | 424 | 1.62% | 183 | 0.70% | 121 | 0.46% | -4,555 | -17.34% | 26,269 |
| Greene | 20,245 | 45.93% | 22,598 | 51.27% | 716 | 1.63% | 124 | 0.28% | 302 | 0.69% | -2,353 | -5.34% | 44,077 |
| Guernsey | 7,573 | 48.78% | 7,746 | 49.90% | 129 | 0.83% | 40 | 0.26% | 20 | 0.13% | -173 | -1.11% | 15,524 |
| Hamilton | 135,605 | 38.41% | 211,267 | 59.84% | 3,930 | 1.11% | 931 | 0.26% | 776 | 0.22% | -75,662 | -21.43% | 353,079 |
| Hancock | 8,548 | 33.74% | 15,983 | 63.09% | 328 | 1.30% | 170 | 0.67% | 219 | 0.87% | -7,435 | -29.35% | 25,333 |
| Hardin | 4,650 | 41.99% | 6,076 | 54.86% | 134 | 1.21% | 61 | 0.55% | 124 | 1.12% | -1,426 | -12.88% | 11,075 |
| Harrison | 4,070 | 52.99% | 3,509 | 45.68% | 68 | 0.89% | 16 | 0.21% | 12 | 0.16% | 561 | 7.30% | 7,681 |
| Henry | 4,592 | 36.82% | 7,656 | 61.40% | 156 | 1.25% | 31 | 0.25% | 19 | 0.15% | -3,064 | -24.57% | 12,470 |
| Highland | 6,327 | 47.46% | 6,853 | 51.41% | 99 | 0.74% | 24 | 0.18% | 14 | 0.11% | -526 | -3.95% | 13,331 |
| Hocking | 5,126 | 54.56% | 4,114 | 43.78% | 118 | 1.26% | 16 | 0.17% | 12 | 0.13% | 1,012 | 10.77% | 9,396 |
| Holmes | 2,242 | 42.31% | 2,870 | 54.16% | 70 | 1.32% | 23 | 0.43% | 83 | 1.57% | -628 | -11.85% | 5,299 |
| Huron | 7,742 | 42.85% | 9,386 | 51.95% | 282 | 1.57% | 141 | 0.78% | 465 | 2.58% | -1,644 | -9.10% | 18,066 |
| Jackson | 6,699 | 52.25% | 5,987 | 46.69% | 80 | 0.62% | 26 | 0.20% | 17 | 0.13% | 712 | 5.55% | 12,822 |
| Jefferson | 22,318 | 59.00% | 14,839 | 39.23% | 481 | 1.27% | 74 | 0.20% | 77 | 0.20% | 7,479 | 19.77% | 37,825 |
| Knox | 7,361 | 43.09% | 9,290 | 54.39% | 244 | 1.43% | 77 | 0.45% | 70 | 0.41% | -1,929 | -11.29% | 17,081 |
| Lake | 40,734 | 51.30% | 36,390 | 45.83% | 1,358 | 1.72% | 408 | 0.52% | 291 | 0.37% | 4,344 | 5.47% | 79,408 |
| Lawrence | 12,072 | 52.50% | 10,668 | 46.39% | 154 | 0.67% | 54 | 0.24% | 29 | 0.13% | 1,404 | 6.11% | 22,996 |
| Licking | 19,247 | 44.01% | 23,518 | 53.78% | 618 | 1.42% | 153 | 0.35% | 106 | 0.24% | -4,271 | -9.77% | 43,733 |
| Logan | 5,949 | 38.62% | 9,092 | 59.03% | 178 | 1.16% | 116 | 0.75% | 41 | 0.27% | -3,143 | -20.41% | 15,402 |
| Lorain | 52,387 | 55.31% | 39,459 | 41.66% | 1,631 | 1.73% | 404 | 0.43% | 525 | 0.56% | 12,928 | 13.65% | 94,711 |
| Lucas | 103,658 | 56.36% | 76,069 | 41.36% | 2,762 | 1.51% | 455 | 0.25% | 545 | 0.30% | 27,589 | 15.00% | 183,907 |
| Madison | 4,885 | 40.17% | 7,074 | 58.17% | 133 | 1.10% | 39 | 0.32% | 12 | 0.10% | -2,189 | -18.00% | 12,161 |
| Mahoning | 75,837 | 60.53% | 46,314 | 36.96% | 1,362 | 1.09% | 533 | 0.43% | 882 | 0.71% | 29,523 | 23.56% | 125,294 |
| Marion | 10,962 | 44.52% | 13,141 | 53.38% | 330 | 1.34% | 84 | 0.34% | 66 | 0.27% | -2,179 | -8.85% | 24,620 |
| Medina | 16,251 | 44.83% | 19,066 | 52.60% | 623 | 1.72% | 135 | 0.37% | 86 | 0.24% | -2,815 | -7.77% | 36,249 |
| Meigs | 5,262 | 50.85% | 4,942 | 47.76% | 95 | 0.92% | 30 | 0.29% | 12 | 0.12% | 320 | 3.09% | 10,348 |
| Mercer | 6,724 | 45.28% | 7,678 | 51.71% | 248 | 1.67% | 122 | 0.82% | 50 | 0.34% | -954 | -6.42% | 14,849 |
| Miami | 13,074 | 40.34% | 18,686 | 57.65% | 407 | 1.26% | 95 | 0.29% | 98 | 0.30% | -5,612 | -17.31% | 32,413 |
| Monroe | 4,296 | 60.24% | 2,728 | 38.25% | 75 | 1.05% | 12 | 0.17% | 16 | 0.22% | 1,568 | 21.99% | 7,132 |
| Montgomery | 106,468 | 50.35% | 100,223 | 47.40% | 2,701 | 1.28% | 567 | 0.27% | 955 | 0.45% | 6,245 | 2.95% | 211,436 |
| Morgan | 2,727 | 46.94% | 2,971 | 51.14% | 66 | 1.14% | 31 | 0.53% | 8 | 0.14% | -244 | -4.20% | 5,809 |
| Morrow | 4,870 | 44.63% | 5,814 | 53.28% | 150 | 1.38% | 49 | 0.45% | 11 | 0.10% | -944 | -8.65% | 10,912 |
| Muskingum | 14,178 | 47.15% | 15,358 | 51.07% | 350 | 1.16% | 119 | 0.40% | 38 | 0.13% | -1,180 | -3.92% | 30,070 |
| Noble | 2,612 | 45.58% | 3,007 | 52.48% | 68 | 1.19% | 24 | 0.42% | 14 | 0.24% | -395 | -6.89% | 5,730 |
| Ottawa | 9,646 | 52.71% | 8,241 | 45.04% | 275 | 1.51% | 78 | 0.43% | 22 | 0.12% | 1,405 | 7.68% | 18,299 |
| Paulding | 3,229 | 46.21% | 3,593 | 51.42% | 101 | 1.45% | 46 | 0.66% | 11 | 0.16% | -364 | -5.21% | 6,987 |
| Perry | 6,268 | 51.64% | 5,637 | 46.44% | 135 | 1.11% | 61 | 0.50% | 19 | 0.16% | 631 | 5.20% | 12,138 |
| Pickaway | 5,907 | 42.06% | 7,695 | 54.79% | 140 | 1.00% | 65 | 0.47% | 169 | 1.21% | -1,788 | -12.73% | 14,045 |
| Pike | 5,734 | 59.89% | 3,729 | 38.95% | 68 | 0.71% | 17 | 0.18% | 17 | 0.18% | 2,005 | 20.94% | 9,574 |
| Portage | 24,417 | 55.72% | 17,927 | 40.91% | 1,008 | 2.31% | 171 | 0.39% | 184 | 0.42% | 6,490 | 14.81% | 43,824 |
| Preble | 5,850 | 45.89% | 6,654 | 52.20% | 132 | 1.04% | 57 | 0.45% | 33 | 0.26% | -804 | -6.31% | 12,747 |
| Putnam | 5,035 | 39.61% | 7,332 | 57.69% | 256 | 2.02% | 59 | 0.46% | 14 | 0.11% | -2,297 | -18.07% | 12,710 |
| Richland | 23,065 | 46.83% | 24,310 | 49.36% | 600 | 1.22% | 228 | 0.46% | 898 | 1.83% | -1,245 | -2.53% | 49,251 |
| Ross | 10,743 | 47.22% | 11,477 | 50.45% | 248 | 1.09% | 77 | 0.34% | 148 | 0.65% | -734 | -3.23% | 22,751 |
| Sandusky | 11,202 | 45.05% | 13,074 | 52.58% | 436 | 1.76% | 88 | 0.35% | 27 | 0.11% | -1,872 | -7.53% | 24,867 |
| Scioto | 18,019 | 57.22% | 13,021 | 41.35% | 218 | 0.69% | 111 | 0.35% | 89 | 0.28% | 4,998 | 15.87% | 31,488 |
| Seneca | 10,074 | 44.74% | 11,730 | 52.10% | 498 | 2.22% | 140 | 0.62% | 39 | 0.17% | -1,656 | -7.35% | 22,516 |
| Shelby | 6,414 | 43.17% | 8,011 | 53.91% | 207 | 1.40% | 182 | 1.23% | 20 | 0.13% | -1,597 | -10.75% | 14,859 |
| Stark | 70,012 | 48.05% | 72,607 | 49.83% | 1,805 | 1.24% | 671 | 0.46% | 336 | 0.23% | -2,595 | -1.78% | 145,709 |
| Summit | 123,711 | 59.09% | 80,415 | 38.41% | 3,192 | 1.53% | 613 | 0.29% | 1,026 | 0.49% | 43,296 | 20.68% | 209,350 |
| Trumbull | 53,828 | 58.16% | 36,469 | 39.41% | 1,068 | 1.16% | 490 | 0.53% | 462 | 0.50% | 17,359 | 18.76% | 92,544 |
| Tuscarawas | 16,880 | 53.01% | 14,279 | 44.84% | 429 | 1.35% | 149 | 0.47% | 50 | 0.16% | 2,601 | 8.17% | 31,841 |
| Union | 4,377 | 36.34% | 7,464 | 61.98% | 117 | 0.97% | 52 | 0.43% | 13 | 0.11% | -3,087 | -25.63% | 12,043 |
| Van Wert | 5,689 | 39.83% | 8,344 | 58.42% | 143 | 1.00% | 64 | 0.45% | 19 | 0.13% | -2,655 | -18.59% | 14,284 |
| Vinton | 2,629 | 54.25% | 2,148 | 44.33% | 46 | 0.95% | 11 | 0.23% | 10 | 0.21% | 481 | 9.93% | 4,846 |
| Warren | 13,349 | 44.59% | 16,115 | 53.83% | 235 | 0.79% | 119 | 0.40% | 74 | 0.25% | -2,766 | -9.24% | 29,935 |
| Washington | 8,914 | 42.25% | 11,513 | 54.57% | 250 | 1.19% | 89 | 0.42% | 275 | 1.31% | -2,599 | -12.32% | 21,096 |
| Wayne | 13,087 | 42.55% | 16,976 | 55.20% | 429 | 1.40% | 105 | 0.34% | 103 | 0.34% | -3,889 | -12.65% | 30,754 |
| Williams | 4,920 | 38.55% | 7,596 | 59.52% | 178 | 1.40% | 34 | 0.27% | 15 | 0.12% | -2,676 | -20.97% | 12,762 |
| Wood | 16,926 | 45.58% | 19,331 | 52.06% | 649 | 1.75% | 117 | 0.32% | 52 | 0.14% | -2,405 | -6.48% | 37,131 |
| Wyandot | 4,043 | 40.65% | 5,661 | 56.92% | 174 | 1.75% | 47 | 0.47% | 11 | 0.11% | -1,618 | -16.27% | 9,946 |
| Totals | 2,011,621 | 48.92% | 2,000,505 | 48.65% | 58,258 | 1.42% | 15,529 | 0.38% | 16,999 | 0.41% | 11,116 | 0.27% | 4,111,874 |
References
- Sullivan, Robert David; ‘How the Red and Blue Map Evolved Over the Past Century’; America Magazine in The National Catholic Review; June 29, 2016
- https://web.archive.org/web/20120825102042/http://www.mit.edu/~mi22295/elections.html#1976
- https://uselectionatlas.org/FORUM/index.php?topic=176237.0
- Dave Leip's U.S. Election Atlas 1976 Presidential General Election Results – Ohio
- Our Campaigns; OH US President November 02, 1976
- Dave Leip's U.S. Election Atlas; 1976 Presidential General Election Data Graphs – Ohio
