1810 and 1811 United States House of Representatives elections
Elections to the United States House of Representatives for the 12th Congress were held at various dates in different states between April 1810 and August 1811 during President James Madison's first term.
| ||||||||||||||||||||||
All 142[lower-alpha 2] seats in the U.S. House of Representatives 72 seats needed for a majority | ||||||||||||||||||||||
|---|---|---|---|---|---|---|---|---|---|---|---|---|---|---|---|---|---|---|---|---|---|---|
| ||||||||||||||||||||||
| ||||||||||||||||||||||
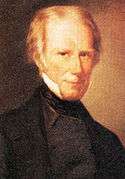

One newly elected Representative, Henry Clay, also was elected Speaker.
With the repeal of the Embargo Act of 1807, the economy improved. The opposition Federalists lost voter support and the Democratic-Republicans recovered a supermajority.
Election summaries
| 107 | 36 |
| Democratic-Republican | Federalist |
| State | Type | ↑ Date |
Total seats |
Democratic- Republican |
Federalist | ||
|---|---|---|---|---|---|---|---|
| Seats | Change | Seats | Change | ||||
| Kentucky | Districts | August 6, 1810 | 6 | 6 | 0 | ||
| New York | Districts | April 24–26, 1810 | 17 | 12 | 5 | ||
| North Carolina | Districts | August 9, 1810 | 12 | 10 | 2 | ||
| Rhode Island | At-large | August 28, 1810 | 2 | 0 | 2 | ||
| Connecticut | At-large | September 17, 1810 | 7 | 0 | 7 | ||
| Georgia | At-large | October 1, 1810 | 4 | 4 | 0 | ||
| Maryland | Districts | 9 | 6 | 3 | |||
| Delaware | At-large | October 2, 1810 | 1 | 0 | 1 | ||
| New Jersey | At-large | October 8–9, 1810 | 6 | 6 | 0 | ||
| South Carolina | Districts | 8 | 8 | 0 | |||
| Ohio | At-large | October 9, 1810 | 1 | 1 | 0 | ||
| Pennsylvania | Districts | 18 | 17 | 1 | |||
| Vermont | Districts | November 4, 1810 | 4 | 3 | 1 | ||
| Massachusetts | Districts | November 5, 1810[lower-alpha 3] | 17 | 9 | 8 | ||
| Late elections (After the March 4, 1811 beginning of the next Congress) | |||||||
| Virginia | Districts | April 1811 | 22 | 17 | 5 | ||
| New Hampshire | At-large | April 1, 1811[lower-alpha 4] | 5 | 4 | 1 | ||
| Tennessee | Districts | August 1–2, 1811 | 3 | 3 | 0 | ||
| Total[lower-alpha 2] | 142 | 106 74.6% |
36 25.4% |
||||
Special elections
There were special elections in 1810 and 1811 to the 11th United States Congress and 12th United States Congress.
Elections are sorted by date then district.
11th Congress
| District | Incumbent | This race | |||
|---|---|---|---|---|---|
| Representative | Party | First elected | Results | Candidates | |
| New York 2 | William Denning | Democratic-Republican | 1808 | Incumbent resigned in 1810. New member elected April 24–26, 1810. Democratic-Republican hold. Successor seated December 4, 1810.[1] Successor also elected the same day to the next term, see below. |
√ Samuel L. Mitchill (Democratic-Republican) 52.4% John B. Coles (Federalist) 47.8%[2] |
| Kentucky 5 | Benjamin Howard | Democratic-Republican | 1806 | Incumbent resigned April 10, 1810 to become Governor of Louisiana Territory. New member elected August 6, 1810. Democratic-Republican hold. Successor seated December 13, 1810.[1] Successor did not run to the next term, see below. |
√ William T. Barry (Democratic-Republican) [data unknown/missing] |
| Connecticut at-large | Samuel W. Dana | Federalist | 1796 (Special) | Incumbent resigned in May 1810 after election as U.S. Senator. New member elected September 17, 1810. Federalist hold. Successor seated December 3, 1810.[1] Successor lost election to the next term, see below. |
√ Ebenezer Huntington (Federalist) 42.5% Lyman Law (Federalist) 38.4% Samuel B. Sherwood (Federalist) 12.5% Nathaniel Terry (Federalist) 2.8% Others (all Federalist) 3.8%[3] |
| Maryland 4 | Roger Nelson | Democratic-Republican | 1804 (Special) | Incumbent resigned May 14, 1810 to become associate judge of the fifth judicial circuit of Maryland. New member elected October 1, 1810. Democratic-Republican hold. Successor seated December 7, 1810.[1] Successor also elected the same day to the next term, see below. |
√ Samuel Ringgold (Democratic-Republican) 98.1% Benjamin Galloway (Federalist) 1.6%[4] |
| Massachusetts 10 "Worcester South district" |
Jabez Upham | Federalist | 1806 | Incumbent resigned in 1810. New member elected October 8, 1810. Federalist hold. Successor seated December 13, 1810.[1] Successor did not run to the next term, see below. |
√ Joseph Allen (Federalist) 55.2% John Spurr (Democratic-Republican) 44.8%[5] |
| Massachusetts 11 "Worcester North district" |
William Stedman | Federalist | 1803 | Incumbent resigned July 16, 1810 to become Clerk of Courts for Worcester County. New member elected October 8, 1810. Federalist hold. Successor seated December 14, 1810.[1] Successor later elected to the next term, see below. |
√ Abijah Bigelow (Federalist) 72.3% Timothy Whiting (Democratic-Republican) 26.9% Moses White (Democratic-Republican) 0.8%[6] |
| New Jersey at-large | James Cox | Democratic-Republican | 1810 | Incumbent died September 12, 1810. New member elected October 30–31, 1810. Democratic-Republican hold. Successor seated December 3, 1810.[1] Successor did not run to the next term, see below. |
√ John A. Scudder (Democratic-Republican) 76.7% John Linn (Democratic-Republican) 10.8% Jacob S. Thompson (Democratic-Republican) 10.2% Isaac Mickle (Democratic-Republican) 2.3%[7] |
| Virginia 1 | John G. Jackson | Democratic-Republican | 1803 | Incumbent resigned September 28, 1810 after being wounded in a duel. New member elected November 1810. Democratic-Republican hold. Successor seated December 21, 1810.[1] Successor late lost election to the next term, see below. |
√ William McKinley (Democratic-Republican) Thomas Wilson (Federalist) Benjamin Reeder[lower-alpha 5] |
| Maryland 7 | John Brown | Democratic-Republican | 1808 | Incumbent resigned in 1810[lower-alpha 6] to become clerk of the county court of Queen Anne's County. New member elected November 15, 1810. Democratic-Republican hold. Successor seated December 3, 1810.[1] New member was also elected by the same ballot to the next term, see below.[lower-alpha 7] |
√ Robert Wright (Democratic-Republican) 51.7% Daniel C. Hopper 45.0% James Brown 3.1% Scattering 0.2%[8] |
| South Carolina 1 | Robert Marion | Democratic-Republican | 1804 | Incumbent resigned December 4, 1810, having already retired. New member elected December 31, 1810. Democratic-Republican hold. Successor seated January 24, 1811.[1]Successor had already been elected to the next term, see below. |
√ Langdon Cheves (Democratic-Republican) Unopposed[9] |
12th Congress
| District | Incumbent | This race | |||
|---|---|---|---|---|---|
| Representative | Party | First elected | Results | Candidates | |
| Maryland 7 | John Brown | Democratic-Republican | 1808 | Representative-elect declined to serve to become clerk of the county court of Queen Anne's County. New member elected November 15, 1810. Democratic-Republican hold. Successor seated at the beginning of the Congress.[10] New member was also elected by the same ballot to finish the current term, see above.[lower-alpha 7] |
√ Robert Wright (Democratic-Republican) 51.7% Daniel C. Hopper 45.0% James Brown 3.1% Scattering 0.2%[8] |
| Maryland 6 | John Montgomery | Democratic-Republican | 1806 | Incumbent resigned April 29, 1811 to become Attorney General of Maryland. New member elected October 2, 1811. Democratic-Republican hold. Successor seated November 4, 1811.[10] |
√ Stevenson Archer (Democratic-Republican) 76.1% William Hollingsworth (Federalist) 23.9%[11][lower-alpha 8] |
| Massachusetts 4 "Middlesex district" |
Joseph B. Varnum | Democratic-Republican | 1795 | Incumbent resigned June 29, 1811 when elected U.S. Senator. New member elected November 4, 1811. Democratic-Republican hold. Successor seated January 22, 1812.[10] |
First ballot (September 23, 1811): John Tuttle (Democratic-Republican) 44.5% Loammi Baldwin (Federalist) 37.4% Edmund Foster (Democratic-Republican) 12.5% Marshall Spring (Democratic-Republican) 5.7%[12] Second ballot (November 4, 1811): √ William M. Richardson (Democratic-Republican) 52.1% Loammi Baldwin (Federalist) 34.7% Edmund Foster (Democratic-Republican) 8.2% Marshall Spring (Democratic-Republican) 5.0%[13] |
Connecticut
| District | Incumbent | This race | |||
|---|---|---|---|---|---|
| Representative | Party | First elected | Results | Candidates | |
| Connecticut at-large 7 seats on a general ticket |
Lewis B. Sturges | Federalist | 1805 (Special) | Incumbent re-elected. | √ Lewis B. Sturges (Federalist) 14.8% √ Jonathan O. Moseley (Federalist) 13.9% √ Benjamin Tallmadge (Federalist) 13.8% √ Epaphroditus Champion (Federalist) 13.6% √ Timothy Pitkin (Federalist) 12.2% √ Lyman Law (Federalist) 11.0% √ John Davenport (Federalist) 8.4% Ebenezer Huntington (Federalist) 3.9% Samuel B. Sherwood (Federalist) 3.2% Nathan Smith (Federalist) 2.0% Nathaniel Terry (Federalist) 1.2% Sylvanus Backus (Federalist) 1.0% Sylvester Gilbert (Federalist) 0.3% John Caldwell (Federalist) 0.3% Uriel Holmes (Federalist) 0.2% Asa Bacon Jr. (Federalist) 0.2% |
| Jonathan O. Moseley | Federalist | 1804 | Incumbent re-elected. | ||
| Benjamin Tallmadge | Federalist | 1801 (Special) | Incumbent re-elected. | ||
| Epaphroditus Champion | Federalist | 1806 | Incumbent re-elected. | ||
| Timothy Pitkin | Federalist | 1805 (Special) | Incumbent re-elected. | ||
| Samuel W. Dana | Federalist | 1796 (Special) | Incumbent resigned in May 1810 after election as U.S. Senator. New member elected. Federalist hold. Successor (Law) was not elected to finish the current term, see above. | ||
| John Davenport | Federalist | 1798 | Incumbent re-elected. | ||
Delaware
| District | Incumbent | This race | |||
|---|---|---|---|---|---|
| Representative | Party | First elected | Results | Candidates | |
| Delaware at-large | Nicholas Van Dyke | Federalist | 1807 (Special) | Incumbent retired. New member elected. Federalist hold. |
√ Henry M. Ridgely (Federalist) 50.1% Richard Dale (Democratic-Republican) 49.9% |
Georgia
| District | Incumbent | This race | |||
|---|---|---|---|---|---|
| Representative | Party | First elected | Results | Candidates | |
| Georgia at-large 4 seats on a general ticket |
William W. Bibb | Democratic-Republican | 1806 | Incumbent re-elected. | √ William W. Bibb (Democratic-Republican) 24.4% √ George Troup (Democratic-Republican) 22.7% √ Howell Cobb (Democratic-Republican) 16.9% √ Bolling Hall (Democratic-Republican) 12.6% Elijah Clarke (Democratic-Republican) 10.7% John Forsyth (Democratic-Republican) 9.1% James Elliot (Federalist) 3.6% |
| George Troup | Democratic-Republican | 1806 | Incumbent re-elected. | ||
| Howell Cobb | Democratic-Republican | 1806 | Incumbent re-elected. | ||
| Dennis Smelt | Democratic-Republican | 1806 (Special) | Incumbent retired. New member elected. Democratic-Republican hold. | ||
Kentucky
| District | Incumbent | This race | |||
|---|---|---|---|---|---|
| Representative | Party | First elected | Results | Candidates | |
| Kentucky 1 | Matthew Lyon | Democratic-Republican | 1797 (Vermont) 1803 |
Incumbent lost re-election. New member elected. Democratic-Republican hold. |
√ Anthony New (Democratic-Republican) 60.3% Matthew Lyon (Democratic-Republican) 39.7% |
| Kentucky 2 | Samuel McKee | Democratic-Republican | 1808 | Incumbent re-elected. | √ Samuel McKee (Democratic-Republican) 100% |
| Kentucky 3 | Henry Crist | Democratic-Republican | 1808 | Incumbent retired. New member elected. Democratic-Republican hold. |
√ Stephen Ormsby (Democratic-Republican) Philip Quinton[lower-alpha 5] |
| Kentucky 4 | Richard M. Johnson | Democratic-Republican | 1806 | Incumbent re-elected. | √ Richard M. Johnson (Democratic-Republican)[lower-alpha 5] John S. Hunter |
| Kentucky 5 | Benjamin Howard | Democratic-Republican | 1806 | Incumbent resigned April 10, 1810 to become Governor of Louisiana Territory. New member elected. Democratic-Republican hold. Successor was not a candidate to finish the current term, see above. |
√ Henry Clay (Democratic-Republican) 100% |
| Kentucky 6 | Joseph Desha | Democratic-Republican | 1806 | Incumbent re-elected. | √ Joseph Desha (Democratic-Republican) 100% |
Maryland
Maryland held its elections October 1, 1810.
| District | Incumbent | This race | |||
|---|---|---|---|---|---|
| Representative | Party | First elected | Results | Candidates[lower-alpha 9] | |
| Maryland 1 | John Campbell | Federalist | 1801 | Incumbent retired. New member elected. Federalist hold. |
√ Philip Stuart (Federalist) 98.3% John Parnham (Democratic-Republican) 1.1% |
| Maryland 2 | Archibald Van Horne | Democratic-Republican | 1806 | Incumbent retired. New member elected. Democratic-Republican hold. |
√ Joseph Kent (Democratic-Republican) 56.4% John F. Mercer (Federalist) 43.6% |
| Maryland 3 | Philip Barton Key | Federalist | 1806 | Incumbent re-elected. | √ Philip Barton Key (Federalist) 100% |
| Maryland 4 | Roger Nelson | Democratic-Republican | 1804 (Special) | Incumbent resigned May 14, 1810 to become associate judge of the fifth judicial circuit of Maryland. New member elected. Democratic-Republican hold. Successor also elected to finish the current term, see above. |
√ Samuel Ringgold (Democratic-Republican) 95.7% Benjamin Galloway (Federalist) 2.0% |
| Maryland 5 Plural district with 2 seats |
Nicholas R. Moore | Democratic-Republican | 1803 | Incumbent lost re-election. New member elected. Democratic-Republican hold. |
√ Alexander McKim (Democratic-Republican) 27.7% √ Peter Little (Democratic-Republican) 25.7% Nicholas R. Moore (Democratic-Republican) 24.4% Joshua Barney (Democratic-Republican) 22.2% |
| Alexander McKim | Democratic-Republican | 1808 | Incumbent re-elected. | ||
| Maryland 6 | John Montgomery | Democratic-Republican | 1806 | Incumbent re-elected. | √ John Montgomery (Democratic-Republican) 98.1% Thomas G. Moffit 1.7% |
| Maryland 7 | John Brown | Democratic-Republican | 1808 | Incumbent re-elected but declined the seat and resigned, leading to a special election. | √ John Brown (Democratic-Republican) 99.7% |
| Maryland 8 | Charles Goldsborough | Federalist | 1804 | Incumbent re-elected. | √ Charles Goldsborough (Federalist) 72.3% Thomas Williams (Democratic-Republican) 27.5% |
Massachusetts
Massachusetts held its elections November 5, 1810. Massachusetts law required a majority for election. This was not met in the 15th district necessitating a second election on April 1, 1811.
| District | Incumbent | This race | |||
|---|---|---|---|---|---|
| Representative | Party | First elected | Results | Candidates[lower-alpha 9] | |
| Massachusetts 1 "Suffolk district" |
Josiah Quincy | Federalist | 1804 | Incumbent re-elected. | √ Josiah Quincy (Federalist) 68.9% David Tilden (Democratic-Republican) 31.1% |
| Massachusetts 2 "Essex South district" |
Benjamin Pickman Jr. | Federalist | 1808 | Incumbent retired. New member elected. Federalist hold. |
√ William Reed (Federalist) 53.6% Daniel Kilham (Democratic-Republican) 46.4% |
| Massachusetts 3 "Essex North district" |
Edward St. Loe Livermore | Federalist | 1806 | Incumbent retired. New member elected. Federalist hold. |
√ Leonard White (Federalist) 62.6% Thomas Kitteridge (Democratic-Republican) 33.5% Nehemiah Cleveland (Federalist) 3.9% |
| Massachusetts 4 "Middlesex district" |
Joseph Bradley Varnum | Democratic-Republican | 1794 | Incumbent re-elected. | √ Joseph Bradley Varnum (Democratic-Republican) 69.2% Loammi Baldwin Jr. (Federalist) 30.8% |
| Massachusetts 5 "Hampshire South district" |
William Ely | Federalist | 1804 | Incumbent re-elected. | √ William Ely (Federalist) 70.4% Samuel Fowler (Democratic-Republican) 29.0% |
| Massachusetts 6 "Hampshire North district" |
Samuel Taggart | Federalist | 1803 | Incumbent re-elected. | √ Samuel Taggart (Federalist) 72.1% Solomon Snead (Democratic-Republican) 27.9% |
| Massachusetts 7 "Plymouth district" |
Charles Turner Jr. | Democratic-Republican | 1808 | Incumbent re-elected. | √ Charles Turner Jr. (Democratic-Republican) 53.5% William Baylies (Federalist) 46.5% |
| Massachusetts 8 "Barnstable district" |
Gideon Gardner | Democratic-Republican | 1808 | Incumbent retired. New member elected. Democratic-Republican hold. |
√ Isaiah L. Green (Democratic-Republican) 57.1% Francis Rotch (Federalist) 42.7% |
| Massachusetts 9 "Bristol district" |
Laban Wheaton | Federalist | 1808 | Incumbent re-elected. | √ Laban Wheaton (Federalist) 51.8% Nathaniel Morton (Democratic-Republican) 48.0% |
| Massachusetts 10 "Worcester South district" |
Joseph Allen | Federalist | 1810 (Special) | Incumbent retired. New member elected. Federalist hold. |
√ Elijah Brigham (Federalist) 53.5% John Spurr (Democratic-Republican) 46.4% |
| Massachusetts 11 "Worcester North district" |
Abijah Bigelow | Federalist | 1810 (Special) | Incumbent re-elected. | √ Abijah Bigelow (Federalist) 70.6% Timothy Whiting (Democratic-Republican) 28.5% |
| Massachusetts 12 "Berkshire district" |
Ezekiel Bacon | Democratic-Republican | 1807 (Special) | Incumbent re-elected. | √ Ezekiel Bacon (Democratic-Republican) 56.1% Thomas Ives (Democratic-Republican) 43.9% |
| Massachusetts 13 "Norfolk district" |
Ebenezer Seaver | Democratic-Republican | 1803 | Incumbent re-elected. | √ Ebenezer Seaver (Democratic-Republican) 63.2% Timothy Jackson (Federalist) 21.2% James Richardson 10.2% James Mann 4.2% Others 1.2% |
| Massachusetts 14 "York district," District of Maine |
Richard Cutts | Democratic-Republicans | 1801 | Incumbent re-elected. | √ Richard Cutts (Democratic-Republican) 62.7% Cyrus King (Federalist) 37.3% |
| Massachusetts 15 "Cumberland district," District of Maine |
Ezekiel Whitman | Federalist | 1808 | Incumbent lost re-election. New member elected. Democratic-Republican gain. |
First ballot November 5, 1810: Ezekiel Whitman (Federalist) 47.8%[lower-alpha 10] William Widgery (Democratic-Republican) 47.8%[lower-alpha 10] Others 4.4% Second ballot April 1, 1811: √ William Widgery (Democratic-Republican) 53.2% Ezekiel Whitman (Federalist) 46.8% |
| Massachusetts 16 "Lincoln district," District of Maine |
Orchard Cook | Democratic-Republican | 1804 | Incumbent retired. New member elected. Democratic-Republican hold. |
√ Peleg Tallman (Democratic-Republican) 61.1% Alden Bradford (Federalist) 38.9% |
| Massachusetts 17 "Kennebec district," District of Maine |
Barzillai Gannett | Democratic-Republican | 1808 | Incumbent re-elected. | √ Barzillai Gannett (Democratic-Republican) 60.5% Thomas Rice (Federalist) 39.5% |
New Hampshire
New Hampshire law required a candidate to receive votes from a majority of voters (10%). In the initial election, only two candidates won a majority, so a second election was held in April 1811 for the remaining three seats, after the congressional term began but before the Congress formally convened. The data from the source used give majorities to all the top five candidates, suggesting that the data are incomplete.
| District | Incumbent | This race | |||
|---|---|---|---|---|---|
| Representative | Party | First elected | Results | Candidates | |
| New Hampshire at-large 5 seats on a general ticket |
Daniel Blaisdell | Federalist | 1808 | Incumbent lost re-election. New member elected. Democratic-Republican gain. |
First ballot (August 27, 1810): √ Josiah Bartlett Jr. (Democratic-Republican) 10.2% √ Samuel Dinsmoor (Democratic-Republican) 10.1% George Sullivan (Federalist) 10.1% William Hale (Federalist) 10.1% Roger Vose (Federalist) 10.0% Daniel Blaisdell (Federalist) 10.0% Obed Hall (Democratic-Republican) 10.0% John Adams Harper (Democratic-Republican) 9.9% James Wilson (Federalist) 9.8% David Morrill (Democratic-Republican) 9.8%[14] Second ballot (April 1, 1811): √ John Adams Harper (Democratic-Republican) 21.2% √ Obed Hall (Democratic-Republican) 21.2% √ George Sullivan (Federalist) 19.2% William Hale (Federalist) 19.1% Daniel Blaisdell (Federalist) 18.9% Roger Vose (Federalist) 0.3%[15] |
| John Curtis Chamberlain | Federalist | 1808 | Incumbent retired. New member elected. Democratic-Republican gain. | ||
| William Hale | Federalist | 1808 | Incumbent lost re-election. New member elected. Democratic-Republican gain. | ||
| Nathaniel Appleton Haven | Federalist | 1808 | Incumbent retired. New member elected. Democratic-Republican gain. | ||
| James Wilson | Federalist | 1808 | Incumbent lost re-election. New member elected. Federalist hold. | ||
New Jersey
The Federalists ran no official ticket in 1810, but votes were received for various Federalists in some counties.
| District | Incumbent | This race | |||
|---|---|---|---|---|---|
| Representative | Party | First elected | Results | Candidates[lower-alpha 9] | |
| New Jersey at-large 6 seats on a general ticket |
Adam Boyd | Democratic-Republican | 1803 1804 (Retired) 1808 (Special) |
Incumbent re-elected. | √ Adam Boyd (Democratic-Republican) 16.4% √ Lewis Condict (Democratic-Republican) 16.4% √ George C. Maxwell (Democratic-Republican) 16.4% √ Jacob Hufty (Democratic-Republican) 16.3% √ Thomas Newbold (Democratic-Republican) 16.3% √ James Morgan (Democratic-Republican) 16.1% Aaron Ogden (Federalist) 0.6% William Coxe Jr. (Federalist) 0.4% John Neilson (Federalist) 0.4% Richard Stockton (Federalist) 0.3% Thomas Sinnickson (Federalist) 0.2% John Beatty (Federalist) 0.2% |
| Thomas Newbold | Democratic-Republican | 1806 | Incumbent re-elected. | ||
| William Helms | Democratic-Republican | 1800 | Incumbent retired. New member elected. Federalist hold. | ||
| John A. Scudder | Democratic-Republican | 1810 (Special) | Incumbent retired. New member elected. Federalist hold. | ||
| Henry Southard | Democratic-Republican | 1800 | Incumbent retired. New member elected. Federalist hold. | ||
| Jacob Hufty | Democratic-Republican | 1808 | Incumbent re-elected. | ||
New York
| District | Incumbent | This race | |||
|---|---|---|---|---|---|
| Representative | Party | First elected | Results | Candidates | |
| New York 1 | Samuel Riker | Democratic-Republican | 1806 | Incumbent retired. New member elected. Democratic-Republican hold. |
√ Ebenezer Sage (Democratic-Republican) 93.5% David Gardiner (Federalist) 6.5% |
| New York 2 Plural district with 2 seats |
William Denning | Democratic-Republican | 1808 | Incumbent resigned in 1810. New member elected. Democratic-Republican hold. Successor also elected the same day to finish the current term, see above. |
√ Samuel L. Mitchill (Democratic-Republican) 26.4% √ William Paulding Jr. (Democratic-Republican) 26.1% John B. Coles (Federalist) 23.8% Peter A. Jay (Federalist) 23.7% |
| Gurdon S. Mumford | Democratic-Republican | 1804 (Special) | Incumbent retired. New member elected. Democratic-Republican hold. | ||
| New York 3 | Jonathan Fisk | Democratic-Republican | 1808 | Incumbent retired. New member elected. Democratic-Republican hold. |
√ Pierre Van Cortlandt Jr. (Democratic-Republican) 63.9% John Bradner (Federalist) 36.1% |
| New York 4 | James Emott | Federalist | 1808 | Incumbent re-elected. | √ James Emott (Federalist) 51.1% Daniel C. Verplanck (Democratic-Republican) 48.9% |
| New York 5 | Barent Gardenier | Federalist | 1806 | Incumbent retired. New member elected. Democratic-Republican gain. |
√ Thomas B. Cooke (Democratic-Republican) 52.1% Gerrit Abeel (Federalist) 47.9% |
| New York 6 Plural district with 2 seats |
Herman Knickerbocker | Federalist | 1808 | Incumbent retired. New member elected. Federalist hold. |
√ Asa Fitch (Federalist) 25.6% √ Robert Le Roy Livingston (Federalist) 25.6% Roger Skinner (Democratic-Republican) 24.4% James L. Hogeboom (Democratic-Republican) 24.4% |
| Robert Le Roy Livingston | Federalist | 1808 | Incumbent re-elected. | ||
| New York 7 | Killian Van Rensselaer | Federalist | 1800 | Incumbent retired. New member elected. Federalist hold. |
√ Harmanus Bleecker (Federalist) 57.6% John V. Veeder (Democratic-Republican) 42.4% |
| New York 8 | John Thompson | Democratic-Republican | 1806 | Incumbent retired. New member elected. Democratic-Republican hold. |
√ Benjamin Pond (Democratic-Republican) 57.6% James McCrea (Federalist) 42.4% |
| New York 9 | Thomas Sammons | Federalist | 1808 | Incumbent re-elected in a different party. Democratic-Republican gain. |
√ Thomas Sammons (Democratic-Republican) 52.6% Richard Van Horne (Federalist) 47.4% |
| New York 10 | John Nicholson | Democratic-Republican | 1808 | Incumbent retired. New member elected. Democratic-Republican hold. |
√ Silas Stow (Democratic-Republican) 51.3% Simeon Ford (Federalist) 48.7% |
| New York 11 | Thomas R. Gold | Federalist | 1808 | Incumbent re-elected. | √ Thomas R. Gold (Federalist) 52.6% Thomas Skinner (Democratic-Republican) 47.4% |
| New York 12 | Erastus Root | Democratic-Republican | 1808 | Incumbent retired. New member elected. Democratic-Republican hold. |
√ Arunah Metcalf (Democratic-Republican) 56.2% John M. Bowers (Federalist) 43.8% |
| New York 13 | Uri Tracy | Democratic-Republican | 1808 | Incumbent re-elected. | √ Uri Tracy (Democratic-Republican) 60.2% Nathaniel Waldron (Federalist) 39.8% |
| New York 14 | Vincent Mathews | Federalist | 1808 | Incumbent retired. New member elected. Democratic-Republican gain. |
√ Daniel Avery (Democratic-Republican) 69.8% John Harris (Federalist) 30.2% |
| New York 15 | Peter B. Porter | Democratic-Republican | 1808 | Incumbent re-elected. | √ Peter B. Porter (Democratic-Republican) 59.1% Ebenezer F. Norton (Federalist) 40.9% |
North Carolina
| District | Incumbent | This race | |||
|---|---|---|---|---|---|
| Representative | Party | First elected | Results | Candidates | |
| North Carolina 1 | Lemuel Sawyer | Democratic-Republican | 1806 | Incumbent re-elected. | √ Lemuel Sawyer (Democratic-Republican) 61.4% William Hinton (Democratic-Republican) 37.1% Joseph Riddick (Democratic-Republican) 1.5% |
| North Carolina 2 | Willis Alston | Democratic-Republican | 1798 | Incumbent re-elected. | √ Willis Alston (Democratic-Republican) 65.9% Joseph H. Bryon (Federalist) 34.1% |
| North Carolina 3 | William Kennedy | Democratic-Republican | 1803 1804 (Lost re-election) 1808 |
Incumbent retired. New member elected. Democratic-Republican hold. |
√ Thomas Blount (Democratic-Republican)[lower-alpha 5] |
| North Carolina 4 | John Stanly | Federalist | 1800 1803 (Lost re-election) 1808 |
Incumbent retired. New member elected. Democratic-Republican gain. |
√ William Blackledge (Democratic-Republican) 54.8% William Gaston (Federalist) 45.2% |
| North Carolina 5 | Thomas Kenan | Democratic-Republican | 1805 (Special) | Incumbent retired. New member elected. Democratic-Republican hold. |
√ William R. King (Democratic-Republican) 67.8% Christopher Dudley (Federalist) 32.2% |
| North Carolina 6 | Nathaniel Macon | Democratic-Republican | 1791 | Incumbent re-elected. | √ Nathaniel Macon (Democratic-Republican) 100% |
| North Carolina 7 | Archibald McBryde | Federalist | 1808 | Incumbent re-elected. | √ Archibald McBryde (Federalist) 57.4% John Culpepper (Federalist) 42.6% |
| North Carolina 8 | Richard Stanford | Democratic-Republican | 1796 | Incumbent re-elected. | √ Richard Stanford (Democratic-Republican) 100% |
| North Carolina 9 | James Cochran | Democratic-Republican | 1808 | Incumbent re-elected. | √ James Cochran (Democratic-Republican) 57.0% Theophilus Lacy (Democratic-Republican) 43.0% |
| North Carolina 10 | Joseph Pearson | Federalist | 1808 | Incumbent re-elected. | √ Joseph Pearson (Federalist) 63.8% James Wallis (Democratic-Republican) 36.4% |
| North Carolina 11 | James Holland | Democratic-Republican | 1800 | Incumbent retired. New member elected. Democratic-Republican hold. |
√ Israel Pickens (Democratic-Republican) 50.5% Felix Walker (Democratic-Republican) 39.8% John Stevelie (Democratic-Republican) 9.7% |
| North Carolina 12 | Meshack Franklin | Democratic-Republican | 1806 | Incumbent re-elected. | √ Meshack Franklin (Democratic-Republican)[lower-alpha 5] |
Ohio
This was the last election in which Ohio had a single at-large district. Due to rapid population growth in the state, the at-large district had become disproportionately populous by this point.
| District | Incumbent | This race | |||
|---|---|---|---|---|---|
| Representative | Party | First elected | Results | Candidates | |
| Ohio at-large | Jeremiah Morrow | Democratic-Republican | 1803 | Incumbent re-elected. | √ Jeremiah Morrow (Democratic-Republican) 99.4% Others 0.6% |
Pennsylvania
| District | Incumbent | This race | |||
|---|---|---|---|---|---|
| Representative | Party | First elected | Results | Candidates[16] | |
| Pennsylvania 1 Plural district with 3 seats |
Adam Seybert | Democratic-Republican | 1809 (Special) | Incumbent re-elected. | √ Adam Seybert (Democratic-Republican) 19.8% √ William Anderson (Democratic-Republican) 19.6% √ James Milnor (Federalist) 13.7% Thomas Truxton (Federalist) 13.7% Thomas Dick (Federalist) 13.4% John Porter (Democratic-Republican) 9.9% Robert McMullin (Democratic-Republican) 9.9% |
| William Anderson | Democratic-Republican | 1808 | Incumbent re-elected. | ||
| John Porter | Democratic-Republican | 1806 | Incumbent lost re-election. New member elected. Federalist gain. | ||
| Pennsylvania 2 Plural district with 3 seats |
Robert Brown | Democratic-Republican | 1798 (Special) | Incumbent re-elected. | √ Robert Brown (Democratic-Republican) 19.1% √ Jonathan Roberts (Democratic-Republican) 19.0% √ William Rodman (Democratic-Republican) 18.9% William Milnor (Federalist) 14.5% Levi Paulding (Federalist) 14.2% William Latimere (Federalist) 13.9% Charles Miner (Federalist) 0.4% |
| William Milnor | Federalist | 1806 | Incumbent lost re-election. New member elected. Democratic-Republican gain. | ||
| John Ross | Democratic-Republican | 1808 | Incumbent retired. New member elected. Democratic-Republican hold. | ||
| Pennsylvania 3 Plural district with 3 seats |
Robert Jenkins | Federalist | 1806 | Incumbent retired. New member elected. Democratic-Republican gain. |
√ Joseph Lefever (Democratic-Republican) 18.4% √ Roger Davis (Democratic-Republican) 18.3% √ John M. Hyneman (Democratic-Republican) 17.2% Daniel Hiester (Federalist)[lower-alpha 11] 16.0% Samuel Bethel (Federalist) 15.1% Mark J. Biddle (Federalist) 15.0% |
| Matthias Richards | Democratic-Republican | 1806 | Incumbent retired. New member elected. Democratic-Republican hold. | ||
| Daniel Hiester | Democratic-Republican | 1808 | Incumbent lost re-election. New member elected. Democratic-Republican hold. | ||
| Pennsylvania 4 Plural district with 2 seats |
Robert Whitehill | Democratic-Republican | 1805 (Special) | Incumbent re-elected. | √ David Bard (Democratic-Republican) 50.0% √ Robert Whitehill (Democratic-Republican) 50.0% |
| David Bard | Democratic-Republican | 1802 | Incumbent re-elected. | ||
| Pennsylvania 5 | George Smith | Democratic-Republican | 1808 | Incumbent re-elected. | √ George Smith (Democratic-Republican) 100% |
| Pennsylvania 6 | William Crawford | Democratic-Republican | 1808 | Incumbent re-elected. | √ William Crawford (Democratic-Republican) 56.6% David Cassat (Federalist) 43.4% |
| Pennsylvania 7 | John Rea | Democratic-Republican | 1802 | Incumbent lost re-election. New member elected. Democratic-Republican hold. |
√ William Piper (Democratic-Republican) 58.5% John Rea (Democratic-Republican) 41.5% |
| Pennsylvania 8 | William Findley | Democratic-Republican | 1802 | Incumbent re-elected. | √ William Findley (Democratic-Republican) 60.9% John Kirkpatrick (Democratic-Republican) 39.1% |
| Pennsylvania 9 | John Smilie | Democratic-Republican | 1792 1794 (Retired) 1798 |
Incumbent re-elected. | √ John Smilie (Democratic-Republican) 100% |
| Pennsylvania 10 | Aaron Lyle | Democratic-Republican | 1808 | Incumbent re-elected. | √ Aaron Lyle (Democratic-Republican) 70.4% Thomas L. Birch (Federalist) 29.6% |
| Pennsylvania 11 | Samuel Smith | Democratic-Republican | 1805 (Special) | Incumbent lost re-election. New member elected. Democratic-Republican hold. |
√ Abner Lacock (Democratic-Republican) 51.0% Alexander Tannehill (Democratic-Republican) 43.2% Samuel Smith (Democratic-Republican) 5.7% |
Rhode Island
| District | Incumbent | This race | |||
|---|---|---|---|---|---|
| Representative | Party | First elected | Results | Candidates | |
| Rhode Island at-large 2 seats on a general ticket |
Richard Jackson Jr. | Federalist | 1808 | Incumbent re-elected. | √ Elisha R. Potter (Federalist) 25.7% √ Richard Jackson Jr. (Federalist) 25.6% Nathaniel Hazard (Democratic-Republican) 24.5% Nathan Brown (Democratic-Republican) 24.2% |
| Elisah R. Potter | Federalist | 1808 | Incumbent re-elected. | ||
South Carolina
| District | Incumbent | This race | |||
|---|---|---|---|---|---|
| Representative | Party | First elected | Results | Candidates | |
| South Carolina 1 "Charleston district" |
Robert Marion | Democratic-Republican | 1804 | Incumbent retired. New member elected. Democratic-Republican hold. Incumbent then resigned December 4, 1810 and successor was also elected to finish the current term, see above. |
√ Langdon Cheves (Democratic-Republican) 89.2%[lower-alpha 8] Others 10.8% |
| South Carolina 2 "Beaufort district" |
William Butler Sr. | Democratic-Republican | 1800 | Incumbent re-elected. | √ William Butler Sr. (Democratic-Republican)[lower-alpha 5] Edmund Bacon (Democratic-Republican) Francisco Annone (Federalist) |
| South Carolina 3 "Georgetown district" |
Robert Witherspoon | Democratic-Republican | 1808 | Incumbent retired. New member elected. Democratic-Republican hold. |
√ David R. Williams (Democratic-Republican) 94.4%[lower-alpha 8] Moses Glover (Federalist) 5.6% |
| South Carolina 4 "Orangeburgh district" |
John Taylor | Democratic-Republican | 1806 | Incumbent lost re-election. New member elected. Democratic-Republican hold. |
√ William Lowndes (Democratic-Republican) 52.2%[lower-alpha 8] John Taylor (Democratic-Republican) 47.8% |
| South Carolina 5 "Sumter district" |
Richard Winn | Democratic-Republican | 1802 (Special) | Incumbent re-elected. | √ Richard Winn (Democratic-Republican) 100% |
| South Carolina 6 "Abbeville district" |
Joseph Calhoun | Democratic-Republican | 1807 (Special) | Incumbent retired. New member elected. Democratic-Republican hold. |
√ John C. Calhoun (Democratic-Republican) 72.2%[lower-alpha 8] John A. Elmore (Democratic-Republican) 27.8% Eastland[lower-alpha 12](Federalist) |
| South Carolina 7 "Chester district" |
Thomas Moore | Democratic-Republican | 1800 | Incumbent re-elected. | √ Thomas Moore (Democratic-Republican) 100% |
| South Carolina 8 "Pendleton district" |
Lemuel J. Alston | Democratic-Republican | 1806 | Incumbent retired. New member elected. Democratic-Republican hold. |
√ Elias Earle (Democratic-Republican) 58.0% William Hunter (Federalist) 42.0% |
Tennessee
| District | Incumbent | This race | |||
|---|---|---|---|---|---|
| Representative | Party | First elected | Results | Candidates | |
| Tennessee 1 | John Rhea | Democratic-Republican | 1803 | Incumbent re-elected. | √ John Rhea (Democratic-Republican) Unopposed |
| Tennessee 2 | Robert Weakley | Democratic-Republican | 1808 | Incumbent retired. New member elected. Democratic-Republican hold. |
√ John Sevier (Democratic-Republican) Unopposed |
| Tennessee 3 | Pleasant M. Miller | Democratic-Republican | 1808 | Incumbent retired. New member elected. Democratic-Republican hold. |
√ Felix Grundy (Democratic-Republican) 60.4% Isaac Roberts 21.7% James Winchester 17.9% |
Vermont
| District | Incumbent | This race | |||
|---|---|---|---|---|---|
| Representative | Party | First elected | Results | Candidates[lower-alpha 9] | |
| Vermont 1 | Samuel Shaw | Democratic-Republican | 1808 | Incumbent re-elected. | √ Samuel Shaw (Democratic-Republican) 64.4% Chauncey Langdon (Federalist) 33.5% |
| Vermont 2 | Jonathan H. Hubbard | Federalist | 1808 | Incumbent lost re-election. New member elected. Democratic-Republican gain. |
√ William Strong (Democratic-Republican) 53.4% Jonathan H. Hubbard (Federalist) 42.1% Aaron Leland (Democratic-Republican) 1.7% |
| Vermont 3 | William Chamberlain | Federalist | 1802 1805 (Lost) 1808 |
Incumbent lost re-election. New member elected. Democratic-Republican gain. |
√ James Fisk (Democratic-Republican) 56.7% William Chamberlain (Federalist) 41.3% |
| Vermont 4 | Martin Chittenden | Federalist | 1802 | Incumbent re-elected. | √ Martin Chittenden (Federalist) 50.0% Ezra Butler (Democratic-Republican) 47.5% |
Virginia
| District | Incumbent | This race | |||
|---|---|---|---|---|---|
| Representative | Party | First elected | Results | Candidates[lower-alpha 9] | |
| Virginia 1 | William McKinley | Democratic-Republican | 1810 (Special) | Incumbent lost re-election. New member elected. Federalist gain. |
√ Thomas Wilson (Federalist) 52.3% William McKinley (Democratic-Republican) 47.7%[17] |
| Virginia 2 | James Stephenson | Federalist | 1809 | Incumbent retired. New member elected. Federalist hold. |
√ John Baker (Federalist) 56.5% Daniel Morgan (Democratic-Republican) 43.5% |
| Virginia 3 | John Smith | Democratic-Republican | 1801 | Incumbent re-elected. | √ John Smith (Democratic-Republican) Unopposed |
| Virginia 4 | Jacob Swoope | Federalist | 1809 | Incumbent retired. New member elected. Democratic-Republican gain. |
√ William McCoy (Democratic-Republican) 52.6% Samuel Blackburn (Federalist) 47.4% |
| Virginia 5 | James Breckinridge | Federalist | 1809 | Incumbent re-elected. | √ James Breckinridge (Federalist) 58.4% Thomas L. Preston (Democratic-Republican) 41.6% |
| Virginia 6 | Daniel Sheffey | Federalist | 1809 | Incumbent re-elected. | √ Daniel Sheffey (Federalist) Unopposed |
| Virginia 7 | Joseph Lewis Jr. | Federalist | 1803 | Incumbent re-elected. | √ Joseph Lewis Jr. (Federalist) 80.0% John Love (Democratic-Republican) 19.9% |
| John Love Moved from the 9th district |
Democratic-Republican | 1807 | Incumbent lost re-election. Democratic-Republican loss. | ||
| Virginia 8 | Walter Jones | Democratic-Republican | 1803 | Incumbent retired. New member elected. Democratic-Republican hold. John Taliaferro (Democratic-Republican), was seated on December 2, 1811 after successfully challenging the election in the House Committee on Elections.[10] |
√ John Hungerford (Democratic-Republican) 50.2%[18] John Taliaferro (Democratic-Republican) 49.8% |
| Virginia 9 | Open seat | Open seat. New member elected. Democratic-Republican gain. |
√ Aylett Hawes (Democratic-Republican) 72.7% George F. Strother (Democratic-Republican) 26.3% | ||
| Virginia 10 | John Dawson | Democratic-Republican | 1797 | Incumbent re-elected. | √ John Dawson (Democratic-Republican) Unopposed |
| Virginia 11 | John Roane | Democratic-Republican | 1809 | Incumbent re-elected. | √ John Roane[lower-alpha 5] (Democratic-Republican) |
| Virginia 12 | Burwell Bassett | Democratic-Republican | 1805 | Incumbent re-elected. | √ Burwell Bassett (Democratic-Republican) 59.5%[lower-alpha 8] John Eyre (Federalist) 40.5% |
| Virginia 13 | William A. Burwell | Democratic-Republican | 1806 (Special) | Incumbent re-elected. | √ William A. Burwell (Democratic-Republican) Unopposed |
| Virginia 14 | Matthew Clay | Democratic-Republican | 1797 | Incumbent re-elected. | √ Matthew Clay (Democratic-Republican)[lower-alpha 13] John Kerr (Democratic-Republican) |
| Virginia 15 | John Randolph Moved from the 16th district |
Democratic-Republican | 1799 | Incumbent re-elected. | √ John Randolph (Democratic-Republican) 67.8% John W. Eppes (Democratic-Republican) 32.2% |
| John W. Eppes Moved from the 16th district |
Democratic-Republican | 1807 | Incumbent lost re-election. Democratic-Republican loss. | ||
| Virginia 16 | Open seat | Open seat. New member elected. Democratic-Republican gain. |
√ James Pleasants (Democratic-Republican) Unopposed | ||
| Virginia 17 | Thomas Gholson Jr. | Democratic-Republican | 1808 (Special) | Incumbent re-elected. | √ Thomas Gholson Jr. (Democratic-Republican)[lower-alpha 5] |
| Virginia 18 | Peterson Goodwyn | Democratic-Republican | 1803 | Incumbent re-elected. | √ Peterson Goodwyn (Democratic-Republican) Unopposed |
| Virginia 19 | Edwin Gray | Democratic-Republican | 1799 | Incumbent re-elected. | √ Edwin Gray (Democratic-Republican) 62.2% Samuel Butler (Democratic-Republican) 37.8% |
| Virginia 20 | Thomas Newton Jr. | Democratic-Republican | 1799 | Incumbent re-elected. | √ Thomas Newton Jr. (Democratic-Republican) 97.7% Robert B. Taylor (Federalist) 2.3% |
| Virginia 21 | David S. Garland | Democratic-Republican | 1809 (Special) | Incumbent retired. New member elected. Democratic-Republican hold. |
√ Hugh Nelson (Democratic-Republican) Unopposed |
| Virginia 22 | John Clopton | Democratic-Republican | 1801 | Incumbent re-elected. | √ John Clopton (Democratic-Republican) Unopposed |
Non-voting delegates
There were five territories with the right to send non-voting delegates to the 12th Congress. Two of them, Illinois Territory and Missouri Territory elected their first representative near the end of the 12th Congress in 1812, while Orleans Territory's seat remained vacant until the territory was admitted as the State of Louisiana.
| District | Incumbent | This race | |||
|---|---|---|---|---|---|
| Representative | Party | First elected | Results | Candidates[lower-alpha 9] | |
| Indiana Territory at-large | Jonathan Jennings | 1809 | [data unknown/missing] | Incumbent re-elected. | √ Jonathan Jennings 65.1% Thomas Randolph 34.9% |
| Mississippi Territory at-large | George Poindexter | 1806 | [data unknown/missing] | Incumbent re-elected. | √ George Poindexter 64.6% Robert Williams 28.2% David Cooper 6.7% |
See also
Notes
- Excludes states admitted during the 12th Congress.
- Includes late elections.
- Majority required for election, which was not met in one district, so a second election held April 1, 1811.
- First ballot held August 27, 1810 but required majority was not met, so a second election was held April 1, 1811.
- Numbers of votes missing or incomplete in source(s).
- John Brown's resignation date is unknown, but it had to be after his October 1, 1810 re-election and before the November 15, 1810 special election to replace him.
- The vacancies, for the remainder of the 11th Congress and the whole of the 12th Congress, were both filled by one ballot. This was the first of three examples of this method being used in Congressional special elections.
- Based on incomplete returns
- Only candidates with at least 1% of the vote listed
- Tied
- Changed parties
- Source did not have full name
- Detailed data not available, but margin of victory given as 223 votes
References
- "11th Congress March 4, 1809, to March 3, 1811". Office of the Historian, United States House of Representatives. Archived from the original on September 22, 2018. Retrieved October 5, 2018.
- "New York 1810 U.S. House of Representatives, District 2, Special". Tufts Digital Collations and Archives. A New Nation Votes: American Election Returns 1787–1825. Tufts University. Retrieved October 8, 2018.
- "Connecticut 1810 U.S. House of Representatives, Special". Tufts Digital Collations and Archives. A New Nation Votes: American Election Returns 1787–1825. Tufts University. Retrieved October 8, 2018.
- "Maryland 1810 U.S. House of Representatives, District 4, Special". Tufts Digital Collations and Archives. A New Nation Votes: American Election Returns 1787–1825. Tufts University. Retrieved October 8, 2018.
- "Massachusetts 1810 U.S. House of Representatives, Worcester South District, Special". Tufts Digital Collations and Archives. A New Nation Votes: American Election Returns 1787–1825. Tufts University. Retrieved October 8, 2018.
- "Massachusetts 1810 U.S. House of Representatives, Worcester North District, Special". Tufts Digital Collations and Archives. A New Nation Votes: American Election Returns 1787–1825. Tufts University. Retrieved October 8, 2018.
- "New Jersey 1810 U.S. House of Representatives, Special". Tufts Digital Collations and Archives. A New Nation Votes: American Election Returns 1787–1825. Tufts University. Retrieved October 8, 2018.
- "Maryland 1810 U.S. House of Representatives, District 7, Special". Tufts Digital Collations and Archives. A New Nation Votes: American Election Returns 1787–1825. Tufts University. Retrieved October 9, 2018.
- "South Carolina 1811 U.S. House of Representatives, District 1, Special". Tufts Digital Collations and Archives. A New Nation Votes: American Election Returns 1787–1825. Tufts University. Retrieved October 8, 2018.
- "12th Congress March 4, 1811, to March 3, 1813". Office of the Historian, United States House of Representatives. Archived from the original on September 22, 2018. Retrieved October 5, 2018.
- "Maryland 1811 U.S. House of Representatives, District 6, Special". Tufts Digital Collations and Archives. A New Nation Votes: American Election Returns 1787–1825. Tufts University. Retrieved October 9, 2018.
- "Massachusetts 1811 U.S. House of Representatives, Middlesex District, Special". Tufts Digital Collations and Archives. A New Nation Votes: American Election Returns 1787–1825. Tufts University. Retrieved October 8, 2018.
- "Massachusetts 1811 U.S. House of Representatives, Middlesex District, Special, Ballot 2". Tufts Digital Collations and Archives. A New Nation Votes: American Election Returns 1787–1825. Tufts University. Retrieved October 8, 2018.
- "NH At-Large". January 4, 2011. Retrieved October 9, 2018 – via OurCampaigns.com.
- "NH At-Large - Runoff". January 4, 2011. Retrieved October 9, 2018 – via OurCampaigns.com.
- Wilkes University Elections Statistics Project
- "Virginia 1811 U.S. House of Representatives, District 1". Tufts Digital Collations and Archives. A New Nation Votes: American Election Returns 1787–1825. Tufts University. Retrieved October 3, 2018.
- "Virginia 1811 U.S. House of Representatives, District 8". Tufts Digital Collations and Archives. A New Nation Votes: American Election Returns 1787–1825. Tufts University. Retrieved October 3, 2018.
Bibliography
- "A New Nation Votes: American Election Returns 1787-1825". Tufts Digital Library, Tufts University. Retrieved January 17, 2015.
- Dubin, Michael J. (March 1, 1998). United States Congressional Elections, 1788-1997: The Official Results of the Elections of the 1st Through 105th Congresses. McFarland and Company. ISBN 978-0786402830.
- Martis, Kenneth C. (January 1, 1989). The Historical Atlas of Political Parties in the United States Congress, 1789-1989. Macmillan Publishing Company. ISBN 978-0029201701.
- "Party Divisions of the House of Representatives* 1789–Present". Office of the Historian, United States House of Representatives. Retrieved January 21, 2015.
External links
- Office of the Historian (Office of Art & Archives, Office of the Clerk, U.S. House of Representatives)