Results breakdown of the 2011 Spanish local elections (Basque Country)
This is the results breakdown of the local elections held in the Basque Country on 22 May 2011. The following tables show detailed results in the autonomous community's most populous municipalities, sorted alphabetically.[1][2][3]
Overall
| Parties and coalitions | Popular vote | Councillors | ||||
|---|---|---|---|---|---|---|
| Votes | % | ±pp | Total | +/− | ||
| Basque Nationalist Party (EAJ/PNV) | 326,135 | 30.07 | –1.10 | 872 | –157 | |
| Gather–Basque Solidarity–Alternative (Bildu–EA–Alternatiba) | 277,278 | 25.56 | +11.11 | 958 | +405 | |
| Basque Solidarity (EA) | 1,127 | 0.10 | –6.94 | 4 | –212 | |
| Socialist Party of the Basque Country–Basque Country Left (PSE–EE (PSOE)) | 177,243 | 16.34 | –8.03 | 235 | –97 | |
| People's Party (PP) | 146,763 | 13.53 | –2.04 | 164 | –21 | |
| United Left–Greens (EB–B)2 | 35,457 | 3.27 | n/a | 15 | –99 | |
| United Left–Greens–Aralar (EB–B–Aralar) | 1,499 | 0.14 | –6.77 | 4 | –89 | |
| Aralar (Aralar)2 | 30,708 | 2.83 | n/a | 34 | +1 | |
| Many with one Goal (H1!) | 9,270 | 0.85 | New | 12 | +12 | |
| Union, Progress and Democracy (UPyD) | 6,683 | 0.62 | New | 0 | ±0 | |
| The Greens (B/LV) | 5,166 | 0.48 | +0.18 | 2 | +1 | |
| For a Fairer World (PUM+J) | 4,026 | 0.37 | +0.25 | 0 | ±0 | |
| The Voice of the People (LVP) | 3,212 | 0.30 | +0.05 | 10 | ±0 | |
| Anti-Bullfighting Party Against Mistreatment of Animals (PACMA/ZAAAA) | 1,867 | 0.17 | +0.08 | 0 | ±0 | |
| Others | 36,995 | 3.41 | — | 319 | –11 | |
| Blank ballots | 23,941 | 2.21 | +0.23 | |||
| Total | 1,084,744 | 2,621 | +34 | |||
| Valid votes | 1,084,744 | 98.62 | +6.93 | |||
| Invalid votes | 15,195 | 1.38 | –6.93 | |||
| Votes cast / turnout | 1,099,939 | 63.61 | +3.15 | |||
| Abstentions | 629,161 | 36.39 | –3.15 | |||
| Registered voters | 1,729,100 | |||||
| Sources[1][4][5] | ||||||
City control
The following table lists party control in the most populous municipalities, including provincial capitals (shown in bold).[1] Gains for a party are displayed with the cell's background shaded in that party's colour.
Municipalities
Barakaldo
- Population: 99,321
 | ||||||
| Parties and coalitions | Popular vote | Seats | ||||
|---|---|---|---|---|---|---|
| Votes | % | ±pp | Total | +/− | ||
| Socialist Party of the Basque Country–Basque Country Left (PSE–EE (PSOE)) | 13,168 | 29.08 | –12.07 | 8 | –3 | |
| Basque Nationalist Party (EAJ/PNV) | 11,283 | 24.92 | +4.05 | 7 | +2 | |
| People's Party (PP) | 7,908 | 17.47 | +1.02 | 5 | +1 | |
| Gather–Basque Solidarity–Alternative (Bildu–EA–Alternatiba)1 | 6,959 | 15.37 | +2.81 | 4 | +1 | |
| United Left–Greens (EB–B) | 2,759 | 6.09 | –1.30 | 1 | –1 | |
| Aralar (Aralar) | 929 | 2.05 | New | 0 | ±0 | |
| For a Fairer World (PUM+J) | 525 | 1.16 | New | 0 | ±0 | |
| Communist Unification of Spain (UCE) | 270 | 0.60 | New | 0 | ±0 | |
| Social and Basque Party (PSyV) | 152 | 0.34 | New | 0 | ±0 | |
| Blank ballots | 1,323 | 2.92 | +1.33 | |||
| Total | 45,276 | 25 | ±0 | |||
| Valid votes | 45,276 | 98.31 | –0.78 | |||
| Invalid votes | 780 | 1.69 | +0.78 | |||
| Votes cast / turnout | 46,056 | 56.46 | –0.12 | |||
| Abstentions | 35,521 | 43.54 | +0.12 | |||
| Registered voters | 81,577 | |||||
| Sources[1][4][6] | ||||||
Basauri
- Population: 42,452
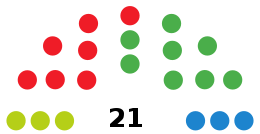 | ||||||
| Parties and coalitions | Popular vote | Seats | ||||
|---|---|---|---|---|---|---|
| Votes | % | ±pp | Total | +/− | ||
| Basque Nationalist Party (EAJ/PNV) | 6,904 | 32.23 | +0.88 | 8 | +1 | |
| Socialist Party of the Basque Country–Basque Country Left (PSE–EE (PSOE)) | 6,751 | 31.52 | –9.00 | 7 | –2 | |
| Gather–Basque Solidarity–Alternative (Bildu–EA–Alternatiba)1 | 3,280 | 15.31 | +11.44 | 3 | +3 | |
| People's Party (PP) | 2,615 | 12.21 | –1.55 | 3 | ±0 | |
| United Left–Greens (EB–B)2 | 912 | 4.26 | n/a | 0 | –1 | |
| Aralar (Aralar)2 | 531 | 2.48 | n/a | 0 | –1 | |
| Blank ballots | 428 | 2.00 | +0.34 | |||
| Total | 21,421 | 21 | ±0 | |||
| Valid votes | 21,421 | 98.67 | +7.04 | |||
| Invalid votes | 288 | 1.33 | –7.04 | |||
| Votes cast / turnout | 21,709 | 61.73 | +3.33 | |||
| Abstentions | 13,457 | 38.27 | –3.33 | |||
| Registered voters | 35,166 | |||||
| Sources[1][4][7] | ||||||
Bilbao
- Population: 353,187
 | ||||||
| Parties and coalitions | Popular vote | Seats | ||||
|---|---|---|---|---|---|---|
| Votes | % | ±pp | Total | +/− | ||
| Basque Nationalist Party (EAJ/PNV) | 74,377 | 44.16 | +2.93 | 15 | +2 | |
| People's Party (PP) | 29,038 | 17.24 | –5.18 | 6 | –1 | |
| Gather–Basque Solidarity–Alternative (Bildu–EA–Alternatiba)1 | 23,932 | 14.21 | +11.51 | 4 | +4 | |
| Socialist Party of the Basque Country–Basque Country Left (PSE–EE (PSOE)) | 22,650 | 13.45 | –8.59 | 4 | –3 | |
| United Left–Greens (EB–B)2 | 5,695 | 3.38 | n/a | 0 | –2 | |
| Aralar (Aralar)2 | 3,214 | 1.91 | n/a | 0 | ±0 | |
| The Greens (B/LV) | 1,875 | 1.11 | +0.26 | 0 | ±0 | |
| Union, Progress and Democracy (UPyD) | 1,812 | 1.08 | New | 0 | ±0 | |
| For a Fairer World (PUM+J) | 910 | 0.54 | +0.25 | 0 | ±0 | |
| Anti-Bullfighting Party Against Mistreatment of Animals (PACMA/ZAAAA) | 810 | 0.48 | New | 0 | ±0 | |
| Humanist Party (PH) | 256 | 0.15 | +0.01 | 0 | ±0 | |
| Family and Life Party (PFyV) | 248 | 0.15 | New | 0 | ±0 | |
| Internationalist Socialist Workers' Party (POSI) | 199 | 0.12 | New | 0 | ±0 | |
| Communist Unification of Spain (UCE) | 178 | 0.11 | New | 0 | ±0 | |
| Carlist Party of the Basque Country (EKA) | 91 | 0.05 | –0.04 | 0 | ±0 | |
| Blank ballots | 3,140 | 1.86 | +0.27 | |||
| Total | 168,425 | 29 | ±0 | |||
| Valid votes | 168,425 | 99.09 | +6.57 | |||
| Invalid votes | 1,546 | 0.91 | –6.57 | |||
| Votes cast / turnout | 169,971 | 61.14 | +4.10 | |||
| Abstentions | 108,028 | 38.86 | –4.10 | |||
| Registered voters | 277,999 | |||||
| Sources[1][4][8][9] | ||||||
Donostia-San Sebastián
- Population: 185,506
 | ||||||
| Parties and coalitions | Popular vote | Seats | ||||
|---|---|---|---|---|---|---|
| Votes | % | ±pp | Total | +/− | ||
| Gather–Basque Solidarity–Alternative (Bildu–EA–Alternatiba)1 | 21,110 | 24.29 | +15.96 | 8 | +6 | |
| Socialist Party of the Basque Country–Basque Country Left (PSE–EE (PSOE)) | 19,666 | 22.63 | –14.80 | 7 | –4 | |
| People's Party (PP) | 16,502 | 18.99 | –2.38 | 6 | ±0 | |
| Basque Nationalist Party (EAJ/PNV) | 15,587 | 17.93 | +0.73 | 6 | +1 | |
| Aralar (Aralar)2 | 3,732 | 4.29 | n/a | 0 | –1 | |
| United Left–Greens (EB–B)2 | 2,283 | 2.63 | n/a | 0 | –2 | |
| Many with one Goal (H1!) | 1,407 | 1.62 | New | 0 | ±0 | |
| Union, Progress and Democracy (UPyD) | 1,284 | 1.48 | New | 0 | ±0 | |
| The Greens (B/LV) | 571 | 0.66 | New | 0 | ±0 | |
| For a Fairer World (PUM+J) | 555 | 0.64 | New | 0 | ±0 | |
| Anti-Bullfighting Party Against Mistreatment of Animals (PACMA/ZAAAA) | 507 | 0.58 | New | 0 | ±0 | |
| The Greens–Green Group (LV–GV) | 506 | 0.58 | New | 0 | ±0 | |
| We, the Women of the Plaza (Plazandreok) | 453 | 0.52 | –0.27 | 0 | ±0 | |
| Independent Liberal Party (PLIn) | 402 | 0.46 | New | 0 | ±0 | |
| Full Citizenship (Denok Hiritar–Ciudadanía Plena) | 22 | 0.03 | New | 0 | ±0 | |
| Blank ballots | 2,334 | 2.69 | –0.41 | |||
| Total | 86,921 | 27 | ±0 | |||
| Valid votes | 86,921 | 98.93 | +11.86 | |||
| Invalid votes | 941 | 1.07 | –11.86 | |||
| Votes cast / turnout | 87,862 | 59.55 | +4.69 | |||
| Abstentions | 59,682 | 40.45 | –4.69 | |||
| Registered voters | 147,544 | |||||
| Sources[1][4][10] | ||||||
Errenteria
- Population: 39,020
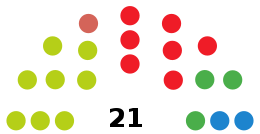 | ||||||
| Parties and coalitions | Popular vote | Seats | ||||
|---|---|---|---|---|---|---|
| Votes | % | ±pp | Total | +/− | ||
| Gather–Basque Solidarity–Alternative (Bildu–EA–Alternatiba)1 | 6,301 | 35.81 | +5.96 | 8 | +1 | |
| Socialist Party of the Basque Country–Basque Country Left (PSE–EE (PSOE)) | 4,970 | 28.24 | –8.79 | 7 | –1 | |
| Basque Nationalist Party (EAJ/PNV) | 2,232 | 12.68 | +0.55 | 3 | +1 | |
| People's Party (PP) | 1,579 | 8.97 | +0.66 | 2 | ±0 | |
| United Left–Greens (EB–B)2 | 952 | 5.41 | n/a | 1 | ±0 | |
| Aralar (Aralar)2 | 515 | 2.93 | n/a | 0 | –1 | |
| Many with one Goal (H1!) | 440 | 2.50 | New | 0 | ±0 | |
| For a Fairer World (PUM+J) | 213 | 1.21 | New | 0 | ±0 | |
| Blank ballots | 395 | 2.24 | +0.47 | |||
| Total | 17,597 | 21 | ±0 | |||
| Valid votes | 17,597 | 98.85 | –0.52 | |||
| Invalid votes | 205 | 1.15 | +0.52 | |||
| Votes cast / turnout | 17,802 | 56.92 | +3.47 | |||
| Abstentions | 13,474 | 43.08 | –3.47 | |||
| Registered voters | 31,276 | |||||
| Sources[1][4][11] | ||||||
Getxo
- Population: 80,277
 | ||||||
| Parties and coalitions | Popular vote | Seats | ||||
|---|---|---|---|---|---|---|
| Votes | % | ±pp | Total | +/− | ||
| Basque Nationalist Party (EAJ/PNV) | 14,182 | 32.92 | –2.18 | 10 | ±0 | |
| People's Party (PP) | 12,982 | 30.13 | –2.99 | 9 | –1 | |
| Gather–Basque Solidarity–Alternative (Bildu–EA–Alternatiba)1 | 7,048 | 16.36 | +12.38 | 4 | +4 | |
| Socialist Party of the Basque Country–Basque Country Left (PSE–EE (PSOE)) | 4,170 | 9.68 | –6.14 | 2 | –2 | |
| United Left–Greens (EB–B)2 | 1,067 | 2.48 | n/a | 0 | –1 | |
| Aralar (Aralar)2 | 863 | 2.00 | n/a | 0 | ±0 | |
| Independents of Getxo (IG/GI) | 757 | 1.76 | New | 0 | ±0 | |
| Union, Progress and Democracy (UPyD) | 593 | 1.38 | New | 0 | ±0 | |
| For a Fairer World (PUM+J) | 360 | 0.84 | New | 0 | ±0 | |
| Social and Basque Party (PSyV) | 71 | 0.16 | New | 0 | ±0 | |
| Blank ballots | 987 | 2.29 | +0.11 | |||
| Total | 43,080 | 25 | ±0 | |||
| Valid votes | 43,080 | 99.04 | +7.40 | |||
| Invalid votes | 419 | 0.96 | –7.40 | |||
| Votes cast / turnout | 43,499 | 67.72 | +5.05 | |||
| Abstentions | 20,733 | 32.28 | –5.05 | |||
| Registered voters | 64,232 | |||||
| Sources[1][4][12] | ||||||
Irun
- Population: 60,938
 | ||||||
| Parties and coalitions | Popular vote | Seats | ||||
|---|---|---|---|---|---|---|
| Votes | % | ±pp | Total | +/− | ||
| Socialist Party of the Basque Country–Basque Country Left (PSE–EE (PSOE)) | 7,904 | 30.85 | –8.77 | 9 | –3 | |
| Basque Nationalist Party (EAJ/PNV) | 4,583 | 17.89 | +2.57 | 5 | +1 | |
| Gather–Basque Solidarity–Alternative (Bildu–EA–Alternatiba)1 | 4,406 | 17.20 | +2.27 | 5 | +2 | |
| People's Party (PP) | 4,393 | 17.15 | +1.06 | 5 | +1 | |
| United Left–Greens (EB–B)2 | 1,556 | 6.07 | n/a | 1 | –1 | |
| Union, Progress and Democracy (UPyD) | 705 | 2.75 | New | 0 | ±0 | |
| Aralar (Aralar)2 | 682 | 2.66 | n/a | 0 | ±0 | |
| Many with one Goal (H1!) | 525 | 2.05 | New | 0 | ±0 | |
| Blank ballots | 865 | 3.38 | +1.41 | |||
| Total | 25,619 | 25 | ±0 | |||
| Valid votes | 25,619 | 98.18 | –0.97 | |||
| Invalid votes | 475 | 1.82 | +0.97 | |||
| Votes cast / turnout | 26,094 | 55.69 | +2.34 | |||
| Abstentions | 20,765 | 44.31 | –2.34 | |||
| Registered voters | 46,859 | |||||
| Sources[1][4][13] | ||||||
Portugalete
- Population: 47,856
 | ||||||
| Parties and coalitions | Popular vote | Seats | ||||
|---|---|---|---|---|---|---|
| Votes | % | ±pp | Total | +/− | ||
| Socialist Party of the Basque Country–Basque Country Left (PSE–EE (PSOE)) | 8,526 | 36.13 | –1.54 | 8 | –1 | |
| Basque Nationalist Party (EAJ/PNV) | 5,825 | 24.69 | –7.42 | 6 | –1 | |
| Gather–Basque Solidarity–Alternative (Bildu–EA–Alternatiba)1 | 3,290 | 13.94 | +11.46 | 3 | +3 | |
| People's Party (PP) | 3,169 | 13.43 | –2.38 | 3 | ±0 | |
| United Left–Greens (EB–B)2 | 1,207 | 5.12 | n/a | 1 | –1 | |
| The Greens (B/LV) | 394 | 1.67 | New | 0 | ±0 | |
| Aralar (Aralar)2 | 364 | 1.54 | n/a | 0 | ±0 | |
| For a Fairer World (PUM+J) | 167 | 0.71 | New | 0 | ±0 | |
| Social and Basque Party (PSyV) | 115 | 0.49 | New | 0 | ±0 | |
| Blank ballots | 539 | 2.28 | +0.31 | |||
| Total | 23,596 | 21 | ±0 | |||
| Valid votes | 23,596 | 98.60 | +5.37 | |||
| Invalid votes | 334 | 1.40 | –5.37 | |||
| Votes cast / turnout | 23,930 | 59.98 | +0.76 | |||
| Abstentions | 15,968 | 32.28 | –0.76 | |||
| Registered voters | 39,898 | |||||
| Sources[1][4][14] | ||||||
Santurtzi
- Population: 47,101
 | ||||||
| Parties and coalitions | Popular vote | Seats | ||||
|---|---|---|---|---|---|---|
| Votes | % | ±pp | Total | +/− | ||
| Basque Nationalist Party (EAJ/PNV) | 11,220 | 48.54 | +3.18 | 12 | +1 | |
| Socialist Party of the Basque Country–Basque Country Left (PSE–EE (PSOE)) | 4,302 | 18.61 | –13.55 | 4 | –3 | |
| Gather–Basque Solidarity–Alternative (Bildu–EA–Alternatiba)1 | 3,184 | 13.77 | +12.27 | 3 | +3 | |
| People's Party (PP) | 2,143 | 9.27 | –2.76 | 2 | ±0 | |
| United Left–Greens (EB–B) | 860 | 3.72 | –3.53 | 0 | –1 | |
| The Greens–Green Group (LV–GV) | 356 | 1.54 | New | 0 | ±0 | |
| Aralar (Aralar) | 337 | 1.46 | New | 0 | ±0 | |
| Social and Basque Party (PSyV) | 194 | 0.84 | New | 0 | ±0 | |
| For a Fairer World (PUM+J) | 113 | 0.49 | New | 0 | ±0 | |
| Blank ballots | 406 | 1.76 | +0.06 | |||
| Total | 23,115 | 21 | ±0 | |||
| Valid votes | 23,115 | 98.74 | +7.49 | |||
| Invalid votes | 295 | 1.26 | –7.49 | |||
| Votes cast / turnout | 23,410 | 60.61 | +1.11 | |||
| Abstentions | 15,214 | 39.39 | –1.11 | |||
| Registered voters | 38,624 | |||||
| Sources[1][4][15] | ||||||
Vitoria-Gasteiz
- Population: 238,247
 | ||||||
| Parties and coalitions | Popular vote | Seats | ||||
|---|---|---|---|---|---|---|
| Votes | % | ±pp | Total | +/− | ||
| People's Party (PP) | 32,300 | 29.19 | –0.55 | 9 | ±0 | |
| Basque Nationalist Party (EAJ/PNV) | 21,143 | 19.11 | –2.78 | 6 | ±0 | |
| Socialist Party of the Basque Country–Basque Country Left (PSE–EE (PSOE)) | 20,727 | 18.73 | –12.64 | 6 | –3 | |
| Gather–Basque Solidarity–Alternative (Bildu–EA–Alternatiba)1 | 19,677 | 17.78 | +12.18 | 6 | +5 | |
| United Left–Greens (EB–B)2 | 4,916 | 4.44 | n/a | 0 | –2 | |
| Aralar (Aralar)2 | 2,571 | 2.32 | n/a | 0 | ±0 | |
| Union, Progress and Democracy (UPyD) | 2,522 | 2.28 | New | 0 | ±0 | |
| The Greens (B/LV) | 1,483 | 1.34 | New | 0 | ±0 | |
| For a Fairer World (PUM+J) | 1,056 | 0.95 | +0.29 | 0 | ±0 | |
| Anti-Bullfighting Party Against Mistreatment of Animals (PACMA/ZAAAA) | 550 | 0.50 | –0.30 | 0 | ±0 | |
| Family and Life Party (PFyV) | 253 | 0.23 | New | 0 | ±0 | |
| Communist Unification of Spain (UCE) | 214 | 0.19 | New | 0 | ±0 | |
| Welcome (Ongi Etorri) | 174 | 0.16 | New | 0 | ±0 | |
| Blank ballots | 3,065 | 2.77 | +1.02 | |||
| Total | 110,651 | 27 | ±0 | |||
| Valid votes | 110,651 | 97.86 | +4.15 | |||
| Invalid votes | 2,415 | 2.14 | –4.15 | |||
| Votes cast / turnout | 113,066 | 61.51 | –0.75 | |||
| Abstentions | 70,741 | 38.49 | +0.75 | |||
| Registered voters | 183,807 | |||||
| Sources[1][4][16] | ||||||
Juntas Generales
References
- "Municipal elections in the Basque Country and Navarre since 1979". historiaelectoral.com (in Spanish). Electoral History. Retrieved 25 March 2018.
- "Elecciones Municipales. 22 de mayo de 2011. Euskadi". elecciones.eldiario.es (in Spanish). eldiario.es. Retrieved 7 June 2019.
- "22M/Elecciones Municipales 2011. Euskadi". especiales.publico.es (in Spanish). Público. Retrieved 28 October 2018.
- "Election Results Archive". euskadi.eus (in Spanish). Basque Government. Retrieved 23 February 2020.
- "Electoral Results Consultation. Municipal. May 2011. Basque Country". www.infoelectoral.mir.es (in Spanish). Ministry of the Interior. Retrieved 25 March 2018.
- "Electoral Results Consultation. Municipal. May 2011. Barakaldo Municipality". www.infoelectoral.mir.es (in Spanish). Ministry of the Interior. Retrieved 25 March 2018.
- "Electoral Results Consultation. Municipal. May 2011. Basauri Municipality". www.infoelectoral.mir.es (in Spanish). Ministry of the Interior. Retrieved 19 June 2020.
- "Electoral Results Consultation. Municipal. May 2011. Bilbao Municipality". www.infoelectoral.mir.es (in Spanish). Ministry of the Interior. Retrieved 25 March 2018.
- "Municipal elections in Bilbao since 1979". historiaelectoral.com (in Spanish). Electoral History. Retrieved 25 March 2018.
- "Electoral Results Consultation. Municipal. May 2011. Donostia-San Sebastián Municipality". www.infoelectoral.mir.es (in Spanish). Ministry of the Interior. Retrieved 25 March 2018.
- "Electoral Results Consultation. Municipal. May 2011. Errenteria Municipality". www.infoelectoral.mir.es (in Spanish). Ministry of the Interior. Retrieved 19 June 2020.
- "Electoral Results Consultation. Municipal. May 2011. Getxo Municipality". www.infoelectoral.mir.es (in Spanish). Ministry of the Interior. Retrieved 25 March 2018.
- "Electoral Results Consultation. Municipal. May 2011. Irun Municipality". www.infoelectoral.mir.es (in Spanish). Ministry of the Interior. Retrieved 25 March 2018.
- "Electoral Results Consultation. Municipal. May 2011. Portugalete Municipality". www.infoelectoral.mir.es (in Spanish). Ministry of the Interior. Retrieved 11 June 2019.
- "Electoral Results Consultation. Municipal. May 2011. Santurtzi Municipality". www.infoelectoral.mir.es (in Spanish). Ministry of the Interior. Retrieved 16 June 2019.
- "Electoral Results Consultation. Municipal. May 2011. Vitoria-Gasteiz Municipality". www.infoelectoral.mir.es (in Spanish). Ministry of the Interior. Retrieved 25 March 2018.
| Regional elections | |
|---|---|
| General elections | |
| European Parliament elections | |
| Foral elections | |
| Local elections | |
| Referendums | |
This article is issued from Wikipedia. The text is licensed under Creative Commons - Attribution - Sharealike. Additional terms may apply for the media files.