Results breakdown of the 2011 Spanish general election (Congress)
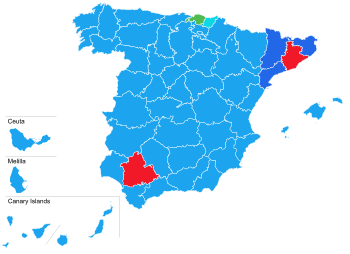
This is the results breakdown of the Congress of Deputies election held in Spain on 20 November 2011. The following tables show detailed results in each of the country's 17 autonomous communities and in the autonomous cities of Ceuta and Melilla, as well as a summary of constituency results.[1][2]
| Main: 2011 Spanish general election | ||||
|---|---|---|---|---|
| 20 November 2011 2015 → | ||||
 | ||||
 | ||||
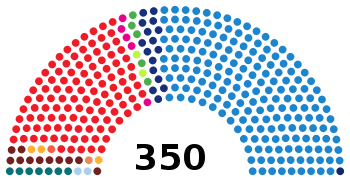
Party | Votes | % | Seats | |
| PP | 10,866,566 | 44.6% | 186 | |
| PSOE | 7,003,511 | 28.8% | 110 | |
| IU–LV | 1,686,040 | 6.9% | 11 | |
| UPyD | 1,143,225 | 4.7% | 5 | |
| CiU | 1,015,691 | 4.2% | 16 | |
| Amaiur | 334,498 | 1.4% | 7 | |
| EAJ/PNV | 324,317 | 1.3% | 5 | |
| esquerra | 256,985 | 1.1% | 3 | |
| BNG | 184,037 | 0.8% | 2 | |
| Others | 1,534,016 | 6.3% | 5 | |
Total | 24,348,886 | 100.0% | 350 | |
Electoral system
348 members of the Congress of Deputies were elected using the D'Hondt method and a closed list proportional representation, with a threshold of three percent of valid votes—which included blank ballots—being applied in each constituency. Parties not reaching the threshold were not taken into consideration for seat distribution. The D'Hondt method might result in a higher effective threshold, depending on the district magnitude.[3] Seats were allocated to constituencies, corresponding to the provinces of Spain, with each being allocated an initial minimum of two seats and the remaining 248 being distributed in proportion to their populations. Ceuta and Melilla were allocated the two remaining seats, which were elected using plurality voting. Voting was on the basis of universal suffrage, which comprised all nationals over eighteen and in full enjoyment of their political rights.[4] Amendments to the electoral law in 2011 required for Spaniards abroad to apply for voting before being permitted to vote, a system known as "begged" or expat vote (Spanish: Voto rogado).[5]
The electoral law allowed for parties and federations registered in the interior ministry, coalitions and groupings of electors to present lists of candidates. Parties and federations intending to form a coalition ahead of an election were required to inform the relevant Electoral Commission within ten days of the election call, whereas groupings of electors needed to secure the signature of at least one percent of the electorate in the constituencies for which they sought election, disallowing electors from signing for more than one list of candidates. Concurrently, parties, federations or coalitions that had not obtained a mandate in either chamber of the Cortes at the preceding election were required to secure the signature of at least 0.1 percent of electors in the aforementioned constituencies.[6][7]
Nationwide
 | ||||||
| Parties and coalitions | Popular vote | Seats | ||||
|---|---|---|---|---|---|---|
| Votes | % | ±pp | Total | +/− | ||
| People's Party (PP)1 | 10,866,566 | 44.63 | +4.52 | 186 | +32 | |
| Spanish Socialist Workers' Party (PSOE) | 7,003,511 | 28.76 | –15.11 | 110 | –59 | |
| United Left–The Greens: Plural Left (IU–LV)2 | 1,686,040 | 6.92 | +3.00 | 11 | +9 | |
| Union, Progress and Democracy (UPyD) | 1,143,225 | 4.70 | +3.51 | 5 | +4 | |
| Convergence and Union (CiU) | 1,015,691 | 4.17 | +1.14 | 16 | +6 | |
| Amaiur (Amaiur)3 | 334,498 | 1.37 | +1.05 | 7 | +7 | |
| Basque Nationalist Party (EAJ/PNV) | 324,317 | 1.33 | +0.14 | 5 | –1 | |
| Republican Left (esquerra) | 256,985 | 1.06 | –0.10 | 3 | ±0 | |
| Equo (Equo) | 216,748 | 0.89 | New | 0 | ±0 | |
| Galician Nationalist Bloc (BNG) | 184,037 | 0.76 | –0.07 | 2 | ±0 | |
| Canarian Coalition–New Canaries–Canarian Nationalist Party (CC–NC–PNC)4 | 143,881 | 0.59 | –0.24 | 2 | ±0 | |
| Bloc–Initiative–Greens–Equo: Commitment Coalition (Compromís–Q)5 | 125,306 | 0.51 | +0.39 | 1 | +1 | |
| Animalist Party Against Mistreatment of Animals (PACMA) | 102,144 | 0.42 | +0.25 | 0 | ±0 | |
| Forum of Citizens (FAC) | 99,473 | 0.41 | New | 1 | +1 | |
| Blank Seats (EB) | 97,673 | 0.40 | +0.38 | 0 | ±0 | |
| Andalusian Party (PA)6 | 76,999 | 0.32 | +0.05 | 0 | ±0 | |
| Platform for Catalonia (PxC) | 59,949 | 0.25 | New | 0 | ±0 | |
| Regionalist Party of Cantabria (PRC) | 44,010 | 0.18 | New | 0 | ±0 | |
| Yes to the Future (GBai)7 | 42,415 | 0.17 | –0.07 | 1 | ±0 | |
| For a Fairer World (PUM+J) | 27,210 | 0.11 | +0.02 | 0 | ±0 | |
| Communist Party of the Peoples of Spain (PCPE) | 26,254 | 0.11 | +0.03 | 0 | ±0 | |
| Anti-capitalists (Anticapitalistas) | 22,289 | 0.09 | New | 0 | ±0 | |
| Pirates of Catalonia (Pirata.cat) | 21,876 | 0.09 | New | 0 | ±0 | |
| Communist Unification of Spain (UCE) | 15,869 | 0.07 | New | 0 | ±0 | |
| Humanist Party (PH) | 10,132 | 0.04 | ±0.00 | 0 | ±0 | |
| Spain 2000 (E–2000) | 9,266 | 0.04 | +0.01 | 0 | ±0 | |
| Internationalist Solidarity and Self-Management (SAIn) | 6,863 | 0.03 | +0.01 | 0 | ±0 | |
| Republicans (RPS) | 5,430 | 0.02 | New | 0 | ±0 | |
| Hartos.org (Hartos.org) | 3,820 | 0.02 | New | 0 | ±0 | |
| Pirate Party (Pirata) | 3,426 | 0.01 | New | 0 | ±0 | |
| Canarian Nationalist Alternative (ANC) | 3,180 | 0.01 | +0.01 | 0 | ±0 | |
| Spanish Phalanx of the CNSO (FE–JONS) | 2,898 | 0.01 | –0.04 | 0 | ±0 | |
| Liberal Democratic Centre (CDL) | 2,848 | 0.01 | ±0.00 | 0 | ±0 | |
| Castilian Party (PCAS)8 | 2,431 | 0.01 | –0.01 | 0 | ±0 | |
| United for Valencia (UxV)9 | 2,210 | 0.01 | ±0.00 | 0 | ±0 | |
| Individual Freedom Party (P–LIB) | 2,065 | 0.01 | New | 0 | ±0 | |
| Regionalist Party of the Leonese Country (PREPAL) | 2,058 | 0.01 | +0.01 | 0 | ±0 | |
| Internationalist Socialist Workers' Party (POSI) | 2,007 | 0.01 | –0.02 | 0 | ±0 | |
| National Democracy (DN) | 1,867 | 0.01 | –0.04 | 0 | ±0 | |
| Regionalist Party for Eastern Andalusia (PRAO) | 1,784 | 0.01 | New | 0 | ±0 | |
| Caballas Coalition (Caballas) | 1,712 | 0.01 | New | 0 | ±0 | |
| XXI Convergence (C.XXI) | 1,443 | 0.01 | New | 0 | ±0 | |
| Unity of the People (UP) | 1,138 | 0.00 | ±0.00 | 0 | ±0 | |
| Convergence for Extremadura (CEx) | 1,090 | 0.00 | New | 0 | ±0 | |
| Andecha Astur (Andecha) | 1,087 | 0.00 | –0.01 | 0 | ±0 | |
| Citizens of Democratic Centre (CCD) | 1,074 | 0.00 | New | 0 | ±0 | |
| Citizens' Action for Málaga (ACIMA) | 966 | 0.00 | New | 0 | ±0 | |
| Family and Life Party (PFyV) | 829 | 0.04 | –0.04 | 0 | ±0 | |
| Death to the System (+MAS+) | 791 | 0.00 | New | 0 | ±0 | |
| Union of Independent Citizens of Toledo (UCIT) | 785 | 0.00 | New | 0 | ±0 | |
| Let us Give the Change (DeC) | 778 | 0.00 | New | 0 | ±0 | |
| Centre and Democracy Forum (CyD) | 720 | 0.00 | New | 0 | ±0 | |
| Regionalist Unity of Castile and León (URCL) | 709 | 0.00 | ±0.00 | 0 | ±0 | |
| Party for the Regeneration of Democracy in Spain (PRDE) | 678 | 0.00 | New | 0 | ±0 | |
| Internet Party (Internet) | 603 | 0.00 | New | 0 | ±0 | |
| Left Republican Party–Republicans (PRE–R) | 419 | 0.00 | New | 0 | ±0 | |
| Enough is Enough, Open Grouping of Political Parties (Basta Ya) | 380 | 0.00 | New | 0 | ±0 | |
| Constitutional and Democratic Party (PDyC) | 304 | 0.00 | New | 0 | ±0 | |
| The Greens–Green Group (LV–GV) | 293 | 0.00 | –0.12 | 0 | ±0 | |
| Democratic Hygiene (HD) | 206 | 0.00 | New | 0 | ±0 | |
| Socialists for Teruel (SxT) | 169 | 0.00 | New | 0 | ±0 | |
| Navarrese and Spanish Right (DNE) | 0 | 0.00 | New | 0 | ±0 | |
| Blank ballots | 333,461 | 1.37 | +0.26 | |||
| Total | 24,348,886 | 350 | ±0 | |||
| Valid votes | 24,348,886 | 98.71 | –0.65 | |||
| Invalid votes | 317,555 | 1.29 | +0.65 | |||
| Votes cast / turnout | 24,666,441 | 68.94 | –4.91 | |||
| Abstentions | 11,113,050 | 31.06 | +4.91 | |||
| Registered voters | 35,779,491 | |||||
| Sources[8][9] | ||||||
Summary
Constituencies
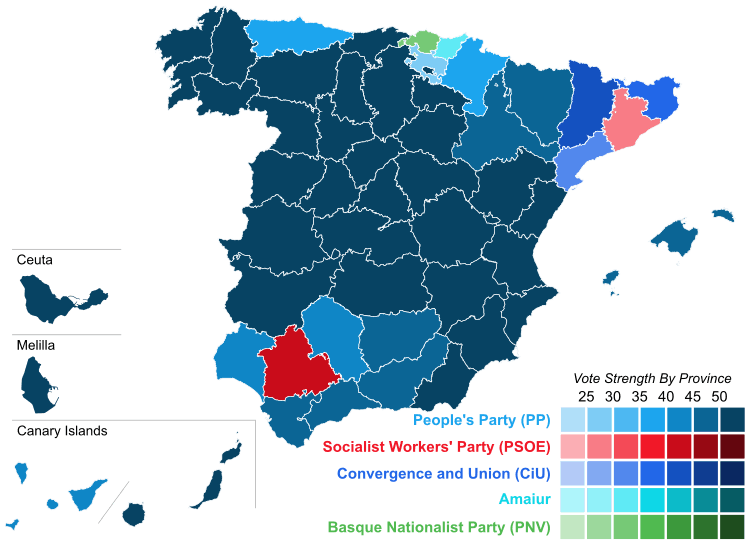
| Constituency | PP | PSOE | IU–LV | UPyD | CiU | Amaiur | PNV | esquerra | BNG | CC–NC | Compromís | FAC | GBai | |||||||||||||
|---|---|---|---|---|---|---|---|---|---|---|---|---|---|---|---|---|---|---|---|---|---|---|---|---|---|---|
| % | S | % | S | % | S | % | S | % | S | % | S | % | S | % | S | % | S | % | S | % | S | % | S | % | S | |
| A Coruña | 51.5 | 5 | 27.3 | 2 | 4.6 | − | 1.3 | − | 11.7 | 1 | ||||||||||||||||
| Álava | 27.2 | 1 | 23.4 | 1 | 4.1 | − | 2.8 | − | 19.1 | 1 | 18.8 | 1 | ||||||||||||||
| Albacete | 55.1 | 3 | 30.1 | 1 | 6.2 | − | 5.0 | − | ||||||||||||||||||
| Alicante | 55.2 | 8 | 27.0 | 4 | 6.5 | − | 5.6 | − | 0.3 | − | 3.1 | − | ||||||||||||||
| Almería | 57.6 | 4 | 29.9 | 2 | 5.3 | − | 3.9 | − | ||||||||||||||||||
| Asturias | 35.4 | 3 | 29.3 | 3 | 13.2 | 1 | 3.9 | − | 14.7 | 1 | ||||||||||||||||
| Ávila | 61.9 | 2 | 22.9 | 1 | 4.5 | − | 7.8 | − | ||||||||||||||||||
| Badajoz | 50.6 | 4 | 37.6 | 2 | 6.0 | − | 3.5 | − | ||||||||||||||||||
| Balearic Islands | 49.6 | 5 | 28.9 | 3 | 4.9 | − | 4.2 | − | 1.1 | − | ||||||||||||||||
| Barcelona | 20.9 | 7 | 27.8 | 10 | 9.1 | 3 | 1.3 | − | 27.2 | 9 | 6.5 | 2 | ||||||||||||||
| Biscay | 17.7 | 1 | 21.4 | 2 | 3.8 | − | 1.7 | − | 19.2 | 2 | 32.6 | 3 | ||||||||||||||
| Burgos | 54.2 | 3 | 28.0 | 1 | 5.6 | − | 7.5 | − | ||||||||||||||||||
| Cáceres | 52.0 | 2 | 36.5 | 2 | 5.3 | − | 3.4 | − | ||||||||||||||||||
| Cádiz | 47.1 | 5 | 32.8 | 3 | 8.7 | − | 4.8 | − | ||||||||||||||||||
| Cantabria | 52.2 | 4 | 25.2 | 1 | 3.6 | − | 3.6 | − | ||||||||||||||||||
| Castellón | 52.8 | 3 | 29.6 | 2 | 5.3 | − | 4.0 | − | 0.5 | − | 4.0 | − | ||||||||||||||
| Ceuta | 65.9 | 1 | 20.3 | − | 1.8 | − | 3.3 | − | ||||||||||||||||||
| Ciudad Real | 55.2 | 3 | 32.0 | 2 | 5.4 | − | 4.4 | − | ||||||||||||||||||
| Córdoba | 44.6 | 3 | 36.4 | 3 | 9.8 | − | 3.8 | − | ||||||||||||||||||
| Cuenca | 55.9 | 2 | 33.0 | 1 | 4.8 | − | 3.6 | − | ||||||||||||||||||
| Gipuzkoa | 13.7 | 1 | 21.0 | 1 | 3.4 | − | 1.5 | − | 34.8 | 3 | 22.4 | 1 | ||||||||||||||
| Girona | 16.2 | 1 | 21.4 | 1 | 5.5 | − | 0.6 | − | 39.2 | 3 | 10.8 | 1 | ||||||||||||||
| Granada | 46.7 | 4 | 36.5 | 3 | 7.9 | − | 5.2 | − | ||||||||||||||||||
| Guadalajara | 54.0 | 2 | 27.7 | 1 | 6.8 | − | 7.5 | − | ||||||||||||||||||
| Huelva | 43.9 | 3 | 40.5 | 2 | 7.0 | − | 3.4 | − | ||||||||||||||||||
| Huesca | 48.5 | 2 | 33.8 | 1 | 8.2 | − | 4.5 | − | ||||||||||||||||||
| Jaén | 45.4 | 3 | 41.0 | 3 | 7.0 | − | 3.4 | − | ||||||||||||||||||
| La Rioja | 54.7 | 3 | 31.1 | 1 | 4.6 | − | 6.0 | − | ||||||||||||||||||
| Las Palmas | 51.0 | 5 | 26.2 | 2 | 4.2 | − | 2.8 | − | 11.3 | 1 | ||||||||||||||||
| León | 52.1 | 3 | 34.2 | 2 | 5.3 | − | 4.7 | − | ||||||||||||||||||
| Lleida | 19.4 | 1 | 20.3 | 1 | 3.9 | − | 0.6 | − | 41.3 | 2 | 8.6 | − | ||||||||||||||
| Lugo | 56.1 | 3 | 28.3 | 1 | 3.1 | − | 0.9 | − | 9.2 | − | ||||||||||||||||
| Madrid | 51.0 | 19 | 26.0 | 10 | 8.0 | 3 | 10.3 | 4 | 0.2 | − | ||||||||||||||||
| Málaga | 49.7 | 6 | 31.6 | 3 | 9.0 | 1 | 5.6 | − | ||||||||||||||||||
| Melilla | 66.7 | 1 | 25.3 | − | 3.7 | − | ||||||||||||||||||||
| Murcia | 64.2 | 8 | 21.0 | 2 | 5.7 | − | 6.3 | − | ||||||||||||||||||
| Navarre | 38.2 | 2 | 22.0 | 1 | 5.5 | − | 2.1 | − | 14.9 | 1 | 12.8 | 1 | ||||||||||||||
| Ourense | 56.7 | 3 | 28.1 | 1 | 2.3 | − | 0.8 | − | 9.3 | − | ||||||||||||||||
| Palencia | 55.1 | 2 | 31.3 | 1 | 5.9 | − | 4.4 | − | ||||||||||||||||||
| Pontevedra | 50.8 | 4 | 28.1 | 2 | 4.6 | − | 1.3 | − | 12.0 | 1 | ||||||||||||||||
| Salamanca | 60.0 | 3 | 26.2 | 1 | 4.3 | − | 6.2 | − | ||||||||||||||||||
| Santa Cruz de Tenerife | 44.8 | 4 | 23.5 | 2 | 4.4 | − | 2.5 | − | 19.8 | 1 | ||||||||||||||||
| Segovia | 56.4 | 2 | 26.8 | 1 | 5.7 | − | 7.4 | − | ||||||||||||||||||
| Seville | 38.7 | 5 | 41.7 | 6 | 8.6 | 1 | 5.5 | − | ||||||||||||||||||
| Soria | 54.9 | 1 | 31.4 | 1 | 4.7 | − | 4.3 | − | ||||||||||||||||||
| Tarragona | 23.6 | 2 | 26.1 | 2 | 5.4 | − | 1.1 | − | 30.5 | 2 | 7.4 | − | ||||||||||||||
| Teruel | 51.8 | 2 | 32.9 | 1 | 7.9 | − | 3.4 | − | ||||||||||||||||||
| Toledo | 57.3 | 4 | 29.2 | 2 | 5.8 | − | 5.0 | − | ||||||||||||||||||
| Valencia | 52.2 | 9 | 26.0 | 4 | 6.8 | 1 | 5.9 | 1 | 0.3 | − | 6.0 | 1 | ||||||||||||||
| Valladolid | 52.9 | 3 | 29.0 | 2 | 7.4 | − | 7.2 | − | ||||||||||||||||||
| Zamora | 57.8 | 2 | 29.7 | 1 | 5.2 | − | 3.9 | − | ||||||||||||||||||
| Zaragoza | 46.9 | 4 | 30.8 | 2 | 11.5 | 1 | 6.4 | − | ||||||||||||||||||
| Total | 44.6 | 186 | 28.8 | 110 | 6.9 | 11 | 4.7 | 5 | 4.2 | 16 | 1.4 | 7 | 1.3 | 5 | 1.1 | 3 | 0.8 | 2 | 0.6 | 2 | 0.5 | 1 | 0.4 | 1 | 0.2 | 1 |
Regions
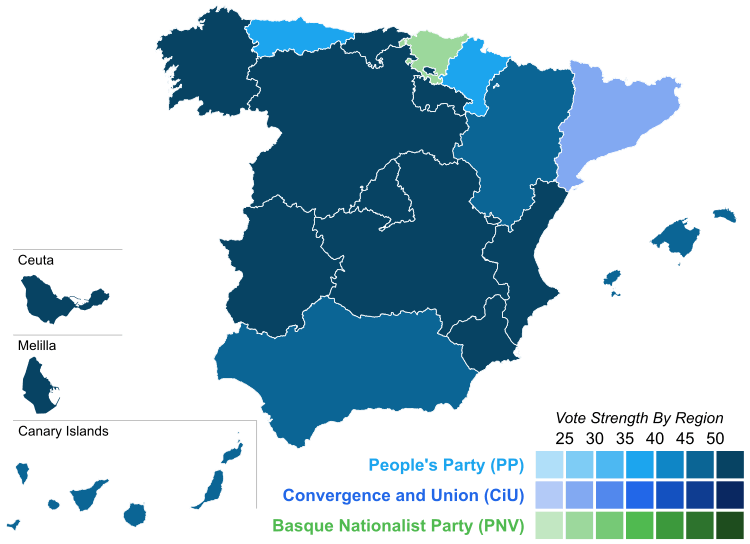
| Region | PP | PSOE | IU–LV | UPyD | CiU | Amaiur | PNV | esquerra | BNG | CC–NC | Compromís | FAC | GBai | |||||||||||||
|---|---|---|---|---|---|---|---|---|---|---|---|---|---|---|---|---|---|---|---|---|---|---|---|---|---|---|
| % | S | % | S | % | S | % | S | % | S | % | S | % | S | % | S | % | S | % | S | % | S | % | S | % | S | |
| Andalusia | 45.6 | 33 | 36.6 | 25 | 8.3 | 2 | 4.8 | − | ||||||||||||||||||
| Aragon | 47.7 | 8 | 31.5 | 4 | 10.5 | 1 | 5.8 | − | ||||||||||||||||||
| Asturias | 35.4 | 3 | 29.3 | 3 | 13.2 | 1 | 3.9 | − | 14.7 | 1 | ||||||||||||||||
| Balearic Islands | 49.6 | 5 | 28.9 | 3 | 4.9 | − | 4.2 | − | 1.1 | − | ||||||||||||||||
| Basque Country | 17.8 | 3 | 21.6 | 4 | 3.7 | − | 1.8 | − | 24.1 | 6 | 27.4 | 5 | ||||||||||||||
| Canary Islands | 48.0 | 9 | 24.9 | 4 | 4.3 | − | 2.6 | − | 15.5 | 2 | ||||||||||||||||
| Cantabria | 52.2 | 4 | 25.2 | 1 | 3.6 | − | 3.6 | − | ||||||||||||||||||
| Castile and León | 55.4 | 21 | 29.2 | 11 | 5.6 | − | 6.1 | − | ||||||||||||||||||
| Castilla–La Mancha | 55.8 | 14 | 30.3 | 7 | 5.8 | − | 5.0 | − | ||||||||||||||||||
| Catalonia | 20.7 | 11 | 26.7 | 14 | 8.1 | 3 | 1.1 | − | 29.3 | 16 | 7.1 | 3 | ||||||||||||||
| Ceuta | 65.9 | 1 | 20.3 | − | 1.8 | − | 3.3 | − | ||||||||||||||||||
| Extremadura | 51.2 | 6 | 37.2 | 4 | 5.7 | − | 3.5 | − | ||||||||||||||||||
| Galicia | 52.5 | 15 | 27.8 | 6 | 4.1 | − | 1.2 | − | 11.2 | 2 | ||||||||||||||||
| La Rioja | 54.7 | 3 | 31.1 | 1 | 4.6 | − | 6.0 | − | ||||||||||||||||||
| Madrid | 51.0 | 19 | 26.0 | 10 | 8.0 | 3 | 10.3 | 4 | 0.2 | − | ||||||||||||||||
| Melilla | 66.7 | 1 | 25.3 | − | 3.7 | − | ||||||||||||||||||||
| Murcia | 64.2 | 8 | 21.0 | 2 | 5.7 | − | 6.3 | − | ||||||||||||||||||
| Navarre | 38.2 | 2 | 22.0 | 1 | 5.5 | − | 2.1 | − | 14.9 | 1 | 12.8 | 1 | ||||||||||||||
| Valencian Community | 53.3 | 20 | 26.8 | 10 | 6.5 | 1 | 5.6 | 1 | 0.3 | – | 4.8 | 1 | ||||||||||||||
| Total | 44.6 | 186 | 28.8 | 110 | 6.9 | 11 | 4.7 | 5 | 4.2 | 16 | 1.4 | 7 | 1.3 | 5 | 1.1 | 3 | 0.8 | 2 | 0.6 | 2 | 0.5 | 1 | 0.4 | 1 | 0.2 | 1 |
Autonomous communities
Andalusia
| Parties and coalitions | Popular vote | Seats | ||||
|---|---|---|---|---|---|---|
| Votes | % | ±pp | Total | +/− | ||
| People's Party (PP) | 1,985,612 | 45.57 | +7.39 | 33 | +8 | |
| Spanish Socialist Workers' Party (PSOE) | 1,594,893 | 36.60 | –15.33 | 25 | –11 | |
| United Left/The Greens–Assembly for Andalusia: Plural Left (IULV–CA) | 360,212 | 8.27 | +3.16 | 2 | +2 | |
| Union, Progress and Democracy (UPyD) | 207,923 | 4.77 | +3.87 | 0 | ±0 | |
| Andalusian Party (PA)1 | 76,999 | 1.77 | +0.25 | 0 | ±0 | |
| Equo (Equo) | 35,639 | 0.82 | New | 0 | ±0 | |
| Blank Seats (EB) | 11,194 | 0.26 | New | 0 | ±0 | |
| Animalist Party Against Mistreatment of Animals (PACMA) | 7,966 | 0.18 | +0.03 | 0 | ±0 | |
| Communist Party of the Peoples of Spain (PCPE) | 5,556 | 0.13 | +0.05 | 0 | ±0 | |
| For a Fairer World (PUM+J) | 2,969 | 0.07 | –0.02 | 0 | ±0 | |
| Anti-capitalists (Anticapitalistas) | 2,890 | 0.07 | New | 0 | ±0 | |
| Communist Unification of Spain (UCE) | 1,909 | 0.04 | New | 0 | ±0 | |
| Internationalist Solidarity and Self-Management (SAIn) | 1,814 | 0.04 | +0.01 | 0 | ±0 | |
| Regionalist Party for Eastern Andalusia (PRAO) | 1,784 | 0.04 | New | 0 | ±0 | |
| Spanish Phalanx of the CNSO (FE–JONS) | 1,662 | 0.04 | ±0.00 | 0 | ±0 | |
| Humanist Party (PH) | 1,656 | 0.04 | ±0.00 | 0 | ±0 | |
| Citizens' Action for Málaga (ACIMA) | 966 | 0.02 | New | 0 | ±0 | |
| Hartos.org (Hartos.org) | 921 | 0.02 | New | 0 | ±0 | |
| National Democracy (DN) | 789 | 0.02 | –0.02 | 0 | ±0 | |
| Internet Party (Internet) | 603 | 0.01 | New | 0 | ±0 | |
| Let us Give the Change (DeC) | 270 | 0.01 | New | 0 | ±0 | |
| Republicans (RPS) | 249 | 0.01 | New | 0 | ±0 | |
| Blank ballots | 53,267 | 1.22 | +0.22 | |||
| Total | 4,357,743 | 60 | –1 | |||
| Valid votes | 4,357,743 | 98.97 | –0.45 | |||
| Invalid votes | 45,305 | 1.03 | +0.45 | |||
| Votes cast / turnout | 4,403,048 | 68.90 | –3.87 | |||
| Abstentions | 1,987,090 | 31.10 | +3.87 | |||
| Registered voters | 6,390,138 | |||||
| Sources[8][10] | ||||||
Aragon
| Parties and coalitions | Popular vote | Seats | ||||
|---|---|---|---|---|---|---|
| Votes | % | ±pp | Total | +/− | ||
| People's Party–Aragonese Party (PP–PAR)1 | 339,502 | 47.70 | +5.47 | 8 | +3 | |
| Spanish Socialist Workers' Party (PSOE) | 224,314 | 31.52 | –14.87 | 4 | –4 | |
| Aragonese Union–United Left: Plural Left (CHA–IU)2 | 74,944 | 10.53 | +2.71 | 1 | +1 | |
| Union, Progress and Democracy (UPyD) | 41,032 | 5.77 | +4.63 | 0 | ±0 | |
| Equo (Equo) | 5,329 | 0.75 | New | 0 | ±0 | |
| Animalist Party Against Mistreatment of Animals (PACMA) | 3,404 | 0.48 | +0.32 | 0 | ±0 | |
| Blank Seats (EB) | 3,106 | 0.44 | New | 0 | ±0 | |
| Communist Party of the Peoples of Spain (PCPE) | 1,409 | 0.20 | +0.16 | 0 | ±0 | |
| For a Fairer World (PUM+J) | 1,376 | 0.19 | +0.13 | 0 | ±0 | |
| Pirate Party (Pirata) | 621 | 0.09 | New | 0 | ±0 | |
| Communist Unification of Spain (UCE) | 570 | 0.08 | New | 0 | ±0 | |
| Let us Give the Change (DeC) | 508 | 0.07 | New | 0 | ±0 | |
| Humanist Party (PH) | 463 | 0.07 | +0.05 | 0 | ±0 | |
| Individual Freedom Party (P–LIB) | 410 | 0.06 | New | 0 | ±0 | |
| Socialists for Teruel (SxT) | 169 | 0.02 | New | 0 | ±0 | |
| Blank ballots | 14,535 | 2.04 | +0.79 | |||
| Total | 711,692 | 13 | ±0 | |||
| Valid votes | 711,692 | 98.43 | –0.45 | |||
| Invalid votes | 11,379 | 1.57 | +0.45 | |||
| Votes cast / turnout | 723,071 | 70.99 | –4.93 | |||
| Abstentions | 295,439 | 29.01 | +4.93 | |||
| Registered voters | 1,018,510 | |||||
| Sources[8][11] | ||||||
Asturias
| Parties and coalitions | Popular vote | Seats | ||||
|---|---|---|---|---|---|---|
| Votes | % | ±pp | Total | +/− | ||
| People's Party (PP) | 223,906 | 35.40 | –6.18 | 3 | –1 | |
| Spanish Socialist Workers' Party (PSOE) | 185,526 | 29.34 | –17.59 | 3 | –1 | |
| Forum of Citizens (FAC) | 92,828 | 14.68 | New | 1 | +1 | |
| United Left of Asturias: Plural Left (IU–IX) | 83,755 | 13.24 | +6.06 | 1 | +1 | |
| Union, Progress and Democracy (UPyD) | 24,721 | 3.91 | +2.55 | 0 | ±0 | |
| Equo (Equo) | 4,033 | 0.64 | New | 0 | ±0 | |
| Blank Seats (EB) | 2,532 | 0.40 | New | 0 | ±0 | |
| Animalist Party Against Mistreatment of Animals (PACMA) | 2,125 | 0.34 | +0.17 | 0 | ±0 | |
| Communist Party of the Peoples of Spain (PCPE) | 1,202 | 0.19 | +0.05 | 0 | ±0 | |
| Andecha Astur (Andecha) | 1,087 | 0.17 | –0.02 | 0 | ±0 | |
| Hartos.org (Hartos.org) | 867 | 0.14 | New | 0 | ±0 | |
| For a Fairer World (PUM+J) | 383 | 0.06 | ±0.00 | 0 | ±0 | |
| Democratic and Constitutional Party (PDyC) | 304 | 0.05 | New | 0 | ±0 | |
| Humanist Party (PH) | 284 | 0.04 | +0.02 | 0 | ±0 | |
| Internationalist Solidarity and Self-Management (SAIn) | 282 | 0.04 | ±0.00 | 0 | ±0 | |
| Communist Unification of Spain (UCE) | 209 | 0.03 | New | 0 | ±0 | |
| Blank ballots | 8,392 | 1.33 | +0.09 | |||
| Total | 632,436 | 8 | ±0 | |||
| Valid votes | 632,436 | 99.03 | –0.32 | |||
| Invalid votes | 6,193 | 0.97 | +0.32 | |||
| Votes cast / turnout | 638,629 | 64.57 | –6.72 | |||
| Abstentions | 350,416 | 35.43 | +6.72 | |||
| Registered voters | 989,045 | |||||
| Sources[8][12] | ||||||
Balearic Islands
| Parties and coalitions | Popular vote | Seats | ||||
|---|---|---|---|---|---|---|
| Votes | % | ±pp | Total | +/− | ||
| People's Party (PP) | 217,327 | 49.59 | +5.62 | 5 | +1 | |
| Spanish Socialist Workers' Party (PSOE) | 126,512 | 28.87 | –15.36 | 3 | –1 | |
| PSM–Initiative Greens–Agreement–Equo (PSM–IV–ExM–eQuo) | 31,417 | 7.17 | +1.80 | 0 | ±0 | |
| United Left of the Balearic Islands: Plural Left (EUIB) | 21,668 | 4.94 | +2.10 | 0 | ±0 | |
| Union, Progress and Democracy (UPyD) | 18,525 | 4.23 | +3.57 | 0 | ±0 | |
| Republican Left (Esquerra) | 4,681 | 1.07 | New | 0 | ±0 | |
| Blank Seats (EB) | 4,271 | 0.97 | New | 0 | ±0 | |
| Animalist Party Against Mistreatment of Animals (PACMA) | 3,641 | 0.83 | +0.58 | 0 | ±0 | |
| For a Fairer World (PUM+J) | 1,093 | 0.25 | +0.16 | 0 | ±0 | |
| Family and Life Party (PFyV) | 746 | 0.17 | +0.11 | 0 | ±0 | |
| Communist Unification of Spain (UCE) | 450 | 0.10 | New | 0 | ±0 | |
| Blank ballots | 7,941 | 1.81 | +0.54 | |||
| Total | 438,272 | 8 | ±0 | |||
| Valid votes | 438,272 | 98.38 | –0.77 | |||
| Invalid votes | 7,216 | 1.62 | +0.77 | |||
| Votes cast / turnout | 445,488 | 60.96 | –6.61 | |||
| Abstentions | 285,252 | 39.04 | +6.61 | |||
| Registered voters | 730,740 | |||||
| Sources[8][13] | ||||||
Basque Country
| Parties and coalitions | Popular vote | Seats | ||||
|---|---|---|---|---|---|---|
| Votes | % | ±pp | Total | +/− | ||
| Basque Nationalist Party (EAJ/PNV) | 324,317 | 27.41 | +0.30 | 5 | –1 | |
| Amaiur (Amaiur)1 | 285,290 | 24.11 | +16.99 | 6 | +6 | |
| Socialist Party of the Basque Country–Basque Country Left (PSE–EE (PSOE)) | 255,013 | 21.55 | –16.59 | 4 | –5 | |
| People's Party (PP) | 210,797 | 17.81 | –0.72 | 3 | ±0 | |
| United Left–The Greens: Plural Left (IU–LV) | 43,717 | 3.69 | –0.77 | 0 | ±0 | |
| Union, Progress and Democracy (UPyD) | 21,282 | 1.80 | +0.86 | 0 | ±0 | |
| Equo (Equo) | 15,351 | 1.30 | New | 0 | ±0 | |
| Animalist Party Against Mistreatment of Animals (PACMA) | 6,446 | 0.54 | +0.16 | 0 | ±0 | |
| For a Fairer World (PUM+J) | 3,486 | 0.29 | +0.04 | 0 | ±0 | |
| Blank Seats (EB) | 2,886 | 0.24 | New | 0 | ±0 | |
| Communist Unification of Spain (UCE) | 1,239 | 0.10 | New | 0 | ±0 | |
| Blank ballots | 13,448 | 1.14 | –0.69 | |||
| Total | 1,183,272 | 18 | ±0 | |||
| Valid votes | 1,183,272 | 98.96 | –0.06 | |||
| Invalid votes | 12,433 | 1.04 | +0.06 | |||
| Votes cast / turnout | 1,195,705 | 67.34 | +3.31 | |||
| Abstentions | 579,843 | 32.66 | –3.31 | |||
| Registered voters | 1,775,548 | |||||
| Sources[8][14] | ||||||
Canary Islands
| Parties and coalitions | Popular vote | Seats | ||||
|---|---|---|---|---|---|---|
| Votes | % | ±pp | Total | +/− | ||
| People's Party (PP) | 446,118 | 47.97 | +12.97 | 9 | +3 | |
| Spanish Socialist Workers' Party (PSOE) | 231,086 | 24.85 | –14.72 | 4 | –3 | |
| Canarian Coalition–New Canaries–Canarian Nationalist Party (CC–NC–PNC)1 | 143,881 | 15.47 | –5.83 | 2 | ±0 | |
| Canarian United Left: Plural Left (IUC) | 40,123 | 4.31 | +3.06 | 0 | ±0 | |
| Union, Progress and Democracy (UPyD) | 24,524 | 2.64 | +2.28 | 0 | ±0 | |
| Equo (Equo) | 15,587 | 1.68 | New | 0 | ±0 | |
| Animalist Party Against Mistreatment of Animals (PACMA) | 4,906 | 0.53 | +0.47 | 0 | ±0 | |
| Canarian Nationalist Alternative (ANC) | 3,180 | 0.34 | +0.24 | 0 | ±0 | |
| For a Fairer World (PUM+J) | 2,672 | 0.29 | +0.20 | 0 | ±0 | |
| Communist Party of the Peoples of Spain (PCPE) | 2,305 | 0.25 | +0.11 | 0 | ±0 | |
| Unity of the People (UP) | 1,138 | 0.12 | +0.05 | 0 | ±0 | |
| Humanist Party (PH) | 1,051 | 0.11 | +0.05 | 0 | ±0 | |
| Communist Unification of Spain (UCE) | 979 | 0.11 | New | 0 | ±0 | |
| Internationalist Solidarity and Self-Management (SAIn) | 316 | 0.03 | +0.01 | 0 | ±0 | |
| Blank ballots | 12,044 | 1.30 | +0.57 | |||
| Total | 929,910 | 15 | ±0 | |||
| Valid votes | 929,910 | 98.30 | –1.04 | |||
| Invalid votes | 16,098 | 1.70 | +1.04 | |||
| Votes cast / turnout | 946,008 | 59.60 | –6.27 | |||
| Abstentions | 641,287 | 40.40 | +6.27 | |||
| Registered voters | 1,587,295 | |||||
| Sources[8][15] | ||||||
Cantabria
| Parties and coalitions | Popular vote | Seats | ||||
|---|---|---|---|---|---|---|
| Votes | % | ±pp | Total | +/− | ||
| People's Party (PP) | 183,244 | 52.17 | +2.18 | 4 | +1 | |
| Spanish Socialist Workers' Party (PSOE) | 88,624 | 25.23 | –18.38 | 1 | –1 | |
| Regionalist Party of Cantabria (PRC) | 44,010 | 12.53 | New | 0 | ±0 | |
| Union, Progress and Democracy (UPyD) | 12,614 | 3.59 | +2.21 | 0 | ±0 | |
| United Left of Cantabria: Plural Left (IUC) | 12,608 | 3.59 | +1.32 | 0 | ±0 | |
| Equo (Equo) | 2,482 | 0.71 | New | 0 | ±0 | |
| Animalist Party Against Mistreatment of Animals (PACMA) | 1,232 | 0.35 | +0.16 | 0 | ±0 | |
| Communist Party of the Peoples of Spain (PCPE) | 578 | 0.16 | +0.03 | 0 | ±0 | |
| Enough is Enough, Open Grouping of Political Parties (Basta Ya) | 380 | 0.11 | New | 0 | ±0 | |
| Anti-capitalists (Anticapitalistas) | 354 | 0.10 | New | 0 | ±0 | |
| Republicans (RPS) | 277 | 0.08 | New | 0 | ±0 | |
| Humanist Party (PH) | 275 | 0.08 | +0.03 | 0 | ±0 | |
| Internationalist Solidarity and Self-Management (SAIn) | 269 | 0.08 | +0.02 | 0 | ±0 | |
| Communist Unification of Spain (UCE) | 145 | 0.04 | New | 0 | ±0 | |
| Blank ballots | 4,157 | 1.18 | –0.05 | |||
| Total | 351,249 | 5 | ±0 | |||
| Valid votes | 351,249 | 98.86 | –0.35 | |||
| Invalid votes | 4,040 | 1.14 | +0.35 | |||
| Votes cast / turnout | 355,289 | 71.56 | –4.82 | |||
| Abstentions | 141,194 | 28.44 | +4.82 | |||
| Registered voters | 496,483 | |||||
| Sources[8][16] | ||||||
Castile and León
| Parties and coalitions | Popular vote | Seats | ||||
|---|---|---|---|---|---|---|
| Votes | % | ±pp | Total | +/− | ||
| People's Party (PP) | 843,110 | 55.37 | +5.36 | 21 | +3 | |
| Spanish Socialist Workers' Party (PSOE) | 444,451 | 29.19 | –13.59 | 11 | –3 | |
| Union, Progress and Democracy (UPyD) | 93,197 | 6.12 | +4.59 | 0 | ±0 | |
| United Left of Castile and León: Plural Left (IUCyL) | 85,814 | 5.64 | +3.13 | 0 | ±0 | |
| Equo (Equo) | 10,166 | 0.67 | New | 0 | ±0 | |
| Animalist Party Against Mistreatment of Animals (PACMA) | 5,436 | 0.36 | +0.21 | 0 | ±0 | |
| For a Fairer World (PUM+J) | 2,767 | 0.18 | +0.09 | 0 | ±0 | |
| Party of Castile and León (PCAL)1 | 2,080 | 0.14 | –0.07 | 0 | ±0 | |
| Regionalist Party of the Leonese Country (PREPAL) | 2,058 | 0.14 | +0.08 | 0 | ±0 | |
| Blank Seats (EB) | 1,335 | 0.09 | New | 0 | ±0 | |
| Spanish Phalanx of the CNSO (FE–JONS) | 1,236 | 0.08 | +0.01 | 0 | ±0 | |
| Internationalist Solidarity and Self-Management (SAIn) | 887 | 0.06 | +0.03 | 0 | ±0 | |
| Communist Party of the Peoples of Spain (PCPE) | 882 | 0.06 | –0.02 | 0 | ±0 | |
| Communist Unification of Spain (UCE) | 795 | 0.05 | New | 0 | ±0 | |
| Regionalist Unity of Castile and León (URCL) | 709 | 0.05 | +0.02 | 0 | ±0 | |
| Anti-capitalists (Anticapitalistas) | 707 | 0.05 | New | 0 | ±0 | |
| National Democracy (DN) | 607 | 0.04 | –0.04 | 0 | ±0 | |
| Citizens of Democratic Centre (CCD) | 506 | 0.03 | New | 0 | ±0 | |
| Democratic Hygiene (HD) | 206 | 0.01 | New | 0 | ±0 | |
| Republicans (RPS) | 200 | 0.01 | New | 0 | ±0 | |
| Hartos.org (Hartos.org) | 174 | 0.01 | New | 0 | ±0 | |
| Family and Life Party (PFyV) | 83 | 0.01 | ±0.00 | 0 | ±0 | |
| Blank ballots | 25,201 | 1.66 | +0.46 | |||
| Total | 1,522,607 | 32 | ±0 | |||
| Valid votes | 1,522,607 | 98.57 | –0.70 | |||
| Invalid votes | 22,136 | 1.43 | +0.70 | |||
| Votes cast / turnout | 1,544,743 | 71.29 | –6.37 | |||
| Abstentions | 622,114 | 28.71 | +6.37 | |||
| Registered voters | 2,166,857 | |||||
| Sources[8][17] | ||||||
Castilla–La Mancha
| Parties and coalitions | Popular vote | Seats | ||||
|---|---|---|---|---|---|---|
| Votes | % | ±pp | Total | +/− | ||
| People's Party (PP) | 654,546 | 55.81 | +6.45 | 14 | +2 | |
| Spanish Socialist Workers' Party (PSOE) | 355,806 | 30.34 | –14.17 | 7 | –2 | |
| United Left of Castilla–La Mancha–The Greens: Plural Left (IUCLM–LV) | 67,817 | 5.78 | +2.85 | 0 | ±0 | |
| Union, Progress and Democracy (UPyD) | 58,224 | 4.96 | +3.87 | 0 | ±0 | |
| Equo (Equo) | 7,847 | 0.67 | New | 0 | ±0 | |
| Animalist Party Against Mistreatment of Animals (PACMA) | 4,156 | 0.35 | +0.26 | 0 | ±0 | |
| Blank Seats (EB) | 2,876 | 0.25 | New | 0 | ±0 | |
| Communist Party of the Peoples of Spain (PCPE) | 1,438 | 0.12 | +0.06 | 0 | ±0 | |
| For a Fairer World (PUM+J) | 1,135 | 0.10 | +0.02 | 0 | ±0 | |
| Hartos.org (Hartos.org) | 789 | 0.07 | New | 0 | ±0 | |
| Union of Independent Citizens of Toledo (UCIT) | 785 | 0.07 | New | 0 | ±0 | |
| Citizens of Democratic Centre (CCD) | 568 | 0.05 | New | 0 | ±0 | |
| National Democracy (DN) | 471 | 0.04 | ±0.00 | 0 | ±0 | |
| Communist Unification of Spain (UCE) | 446 | 0.04 | New | 0 | ±0 | |
| Castilian Party (PCAS)1 | 351 | 0.03 | –0.02 | 0 | ±0 | |
| Anti-capitalists (Anticapitalistas) | 194 | 0.02 | New | 0 | ±0 | |
| Centre and Democracy Forum (CyD) | 192 | 0.02 | New | 0 | ±0 | |
| Liberal Democratic Centre (CDL) | 178 | 0.02 | New | 0 | ±0 | |
| Blank ballots | 15,033 | 1.28 | +0.31 | |||
| Total | 1,172,852 | 21 | ±0 | |||
| Valid votes | 1,172,852 | 98.51 | –0.75 | |||
| Invalid votes | 17,718 | 1.49 | +0.75 | |||
| Votes cast / turnout | 1,190,570 | 75.76 | –4.26 | |||
| Abstentions | 380,928 | 24.24 | +4.26 | |||
| Registered voters | 1,571,498 | |||||
| Sources[8][18] | ||||||
Catalonia
| Parties and coalitions | Popular vote | Seats | ||||
|---|---|---|---|---|---|---|
| Votes | % | ±pp | Total | +/− | ||
| Convergence and Union (CiU) | 1,015,691 | 29.35 | +8.42 | 16 | +6 | |
| Socialists' Party of Catalonia (PSC–PSOE) | 922,547 | 26.66 | –18.73 | 14 | –11 | |
| People's Party (PP) | 716,371 | 20.70 | +4.30 | 11 | +3 | |
| Initiative for Catalonia Greens–United and Alternative Left: Plural L. (ICV–EUiA) | 280,152 | 8.09 | +3.17 | 3 | +2 | |
| Republican Left of Catalonia–Rally–Catalonia Yes (ERC–RI.cat) | 244,854 | 7.07 | –0.76 | 3 | ±0 | |
| Platform for Catalonia (PxC) | 59,949 | 1.73 | New | 0 | ±0 | |
| Blank Seats (EB) | 50,879 | 1.47 | +1.33 | 0 | ±0 | |
| Union, Progress and Democracy (UPyD) | 39,650 | 1.15 | +0.98 | 0 | ±0 | |
| Animalist Party Against Mistreatment of Animals (PACMA) | 23,826 | 0.69 | +0.40 | 0 | ±0 | |
| Pirates of Catalonia (Pirata.cat) | 21,876 | 0.63 | New | 0 | ±0 | |
| Anti-capitalists (Anticapitalistas) | 13,876 | 0.40 | New | 0 | ±0 | |
| Communist Unification of Spain (UCE) | 3,904 | 0.11 | New | 0 | ±0 | |
| Communist Party of the Catalan People (PCPC) | 1,547 | 0.04 | –0.07 | 0 | ±0 | |
| Hartos.org (Hartos.org) | 1,069 | 0.03 | New | 0 | ±0 | |
| Left Republican Party–Republicans (PRE–R) | 419 | 0.01 | New | 0 | ±0 | |
| For a Fairer World (PUM+J) | 366 | 0.01 | –0.05 | 0 | ±0 | |
| Blank ballots | 63,884 | 1.85 | +0.31 | |||
| Total | 3,460,860 | 47 | ±0 | |||
| Valid votes | 3,460,860 | 98.42 | –1.05 | |||
| Invalid votes | 55,450 | 1.58 | +1.05 | |||
| Votes cast / turnout | 3,516,310 | 65.16 | –5.14 | |||
| Abstentions | 1,880,031 | 34.84 | +5.14 | |||
| Registered voters | 5,396,341 | |||||
| Sources[8][19] | ||||||
Extremadura
| Parties and coalitions | Popular vote | Seats | ||||
|---|---|---|---|---|---|---|
| Votes | % | ±pp | Total | +/− | ||
| People's Party–United Extremadura (PP–EU)1 | 339,237 | 51.18 | +9.03 | 6 | +1 | |
| Spanish Socialist Workers' Party (PSOE) | 246,514 | 37.19 | –15.10 | 4 | –1 | |
| United Left–Greens–Independent Socialists: Plural Left (IU–V–SIEx) | 37,766 | 5.70 | +2.75 | 0 | ±0 | |
| Union, Progress and Democracy (UPyD) | 22,913 | 3.46 | +2.69 | 0 | ±0 | |
| Equo (Equo) | 3,496 | 0.53 | New | 0 | ±0 | |
| Animalist Party Against Mistreatment of Animals (PACMA) | 2,257 | 0.34 | +0.22 | 0 | ±0 | |
| For a Fairer World (PUM+J) | 1,530 | 0.23 | +0.09 | 0 | ±0 | |
| Convergence for Extremadura (CEx) | 1,090 | 0.16 | New | 0 | ±0 | |
| Communist Unification of Spain (UCE) | 256 | 0.04 | New | 0 | ±0 | |
| Blank ballots | 7,773 | 1.17 | +0.34 | |||
| Total | 662,832 | 10 | ±0 | |||
| Valid votes | 662,832 | 98.59 | –0.72 | |||
| Invalid votes | 9,469 | 1.41 | +0.72 | |||
| Votes cast / turnout | 672,301 | 73.91 | –4.64 | |||
| Abstentions | 237,264 | 26.09 | +4.64 | |||
| Registered voters | 909,565 | |||||
| Sources[8][20] | ||||||
Galicia
| Parties and coalitions | Popular vote | Seats | ||||
|---|---|---|---|---|---|---|
| Votes | % | ±pp | Total | +/− | ||
| People's Party (PP) | 864,567 | 52.53 | +8.67 | 15 | +4 | |
| Socialists' Party of Galicia (PSdeG–PSOE) | 457,633 | 27.81 | –12.83 | 6 | –4 | |
| Galician Nationalist Bloc (BNG) | 184,037 | 11.18 | –0.33 | 2 | ±0 | |
| United Left–The Greens: Plural Left (EU–V) | 67,751 | 4.12 | +2.75 | 0 | ±0 | |
| Union, Progress and Democracy (UPyD) | 19,969 | 1.21 | +0.66 | 0 | ±0 | |
| Equo (Equo) | 10,059 | 0.61 | New | 0 | ±0 | |
| Animalist Party Against Mistreatment of Animals (PACMA) | 7,374 | 0.45 | +0.30 | 0 | ±0 | |
| For a Fairer World (PUM+J) | 1,895 | 0.12 | ±0.00 | 0 | ±0 | |
| Communist Party of the Peoples of Spain (PCPE) | 1,585 | 0.10 | –0.07 | 0 | ±0 | |
| XXI Convergence (C.XXI) | 1,443 | 0.09 | New | 0 | ±0 | |
| Communist Unification of Spain (UCE) | 1,200 | 0.07 | New | 0 | ±0 | |
| Internationalist Solidarity and Self-Management (SAIn) | 884 | 0.05 | +0.03 | 0 | ±0 | |
| Humanist Party (PH) | 694 | 0.04 | –0.02 | 0 | ±0 | |
| Blank ballots | 26,726 | 1.62 | +0.58 | |||
| Total | 1,645,817 | 23 | ±0 | |||
| Valid votes | 1,645,817 | 98.38 | –0.91 | |||
| Invalid votes | 27,024 | 1.62 | +0.91 | |||
| Votes cast / turnout | 1,672,841 | 62.21 | –8.27 | |||
| Abstentions | 1,015,975 | 37.79 | +8.27 | |||
| Registered voters | 2,688,816 | |||||
| Sources[8][21] | ||||||
La Rioja
| Parties and coalitions | Popular vote | Seats | ||||
|---|---|---|---|---|---|---|
| Votes | % | ±pp | Total | +/− | ||
| People's Party (PP) | 95,124 | 54.70 | +5.19 | 3 | +1 | |
| Spanish Socialist Workers' Party (PSOE) | 54,066 | 31.09 | –12.54 | 1 | –1 | |
| Union, Progress and Democracy (UPyD) | 10,367 | 5.96 | +4.68 | 0 | ±0 | |
| United Left: Plural Left (IU) | 7,995 | 4.60 | +2.66 | 0 | ±0 | |
| Equo (Equo) | 1,626 | 0.93 | New | 0 | ±0 | |
| Animalist Party Against Mistreatment of Animals (PACMA) | 779 | 0.45 | New | 0 | ±0 | |
| For a Fairer World (PUM+J) | 686 | 0.39 | +0.27 | 0 | ±0 | |
| Communist Party of the Peoples of Spain (PCPE) | 380 | 0.22 | +0.14 | 0 | ±0 | |
| Communist Unification of Spain (UCE) | 94 | 0.05 | New | 0 | ±0 | |
| Blank ballots | 2,793 | 1.61 | +0.51 | |||
| Total | 173,910 | 4 | ±0 | |||
| Valid votes | 173,910 | 98.42 | –0.88 | |||
| Invalid votes | 2,797 | 1.58 | +0.88 | |||
| Votes cast / turnout | 176,707 | 72.78 | –6.51 | |||
| Abstentions | 66,093 | 27.22 | +6.51 | |||
| Registered voters | 242,800 | |||||
| Sources[8][22] | ||||||
Madrid
| Parties and coalitions | Popular vote | Seats | ||||
|---|---|---|---|---|---|---|
| Votes | % | ±pp | Total | +/− | ||
| People's Party (PP) | 1,719,709 | 50.97 | +1.78 | 19 | +1 | |
| Spanish Socialist Workers' Party (PSOE) | 878,724 | 26.05 | –13.63 | 10 | –5 | |
| Union, Progress and Democracy (UPyD) | 347,354 | 10.30 | +6.56 | 4 | +3 | |
| United Left–The Greens: Plural Left (IU–LV) | 271,209 | 8.04 | +3.38 | 3 | +2 | |
| Equo (Equo) | 65,169 | 1.93 | New | 0 | ±0 | |
| Animalist Party Against Mistreatment of Animals (PACMA) | 13,136 | 0.39 | +0.26 | 0 | ±0 | |
| Blank Seats (EB) | 12,877 | 0.38 | New | 0 | ±0 | |
| Forum of Citizens (FAC) | 6,645 | 0.20 | New | 0 | ±0 | |
| For a Fairer World (PUM+J) | 5,314 | 0.16 | +0.09 | 0 | ±0 | |
| Anti-capitalists (Anticapitalistas) | 4,268 | 0.13 | New | 0 | ±0 | |
| Communist Party of the Peoples of Spain (PCPE) | 3,815 | 0.11 | +0.05 | 0 | ±0 | |
| Humanist Party (PH) | 2,706 | 0.08 | –0.05 | 0 | ±0 | |
| Republicans (RPS) | 2,183 | 0.06 | New | 0 | ±0 | |
| Internationalist Socialist Workers' Party (POSI) | 1,723 | 0.05 | +0.01 | 0 | ±0 | |
| Individual Freedom Party (P–LIB) | 1,655 | 0.05 | New | 0 | ±0 | |
| Internationalist Solidarity and Self-Management (SAIn) | 1,350 | 0.04 | +0.03 | 0 | ±0 | |
| Communist Unification of Spain (UCE) | 875 | 0.03 | New | 0 | ±0 | |
| Blank ballots | 35,093 | 1.04 | +0.09 | |||
| Total | 3,373,805 | 36 | +1 | |||
| Valid votes | 3,373,805 | 98.96 | –0.52 | |||
| Invalid votes | 35,526 | 1.04 | +0.52 | |||
| Votes cast / turnout | 3,409,331 | 73.26 | –5.82 | |||
| Abstentions | 1,244,448 | 26.74 | +5.82 | |||
| Registered voters | 4,653,779 | |||||
| Sources[8][23] | ||||||
Murcia
| Parties and coalitions | Popular vote | Seats | ||||
|---|---|---|---|---|---|---|
| Votes | % | ±pp | Total | +/− | ||
| People's Party (PP) | 471,851 | 64.22 | +2.98 | 8 | +1 | |
| Spanish Socialist Workers' Party (PSOE) | 154,225 | 20.99 | –11.86 | 2 | –1 | |
| Union, Progress and Democracy (UPyD) | 45,984 | 6.26 | +5.32 | 0 | ±0 | |
| United Left–Greens of the Region of Murcia: Plural Left (IU–V–RM) | 41,896 | 5.70 | +2.76 | 0 | ±0 | |
| Equo (Equo) | 4,464 | 0.61 | New | 0 | ±0 | |
| Animalist Party Against Mistreatment of Animals (PACMA) | 2,629 | 0.36 | +0.21 | 0 | ±0 | |
| Blank Seats (EB) | 1,745 | 0.24 | New | 0 | ±0 | |
| Communist Party of the Peoples of Spain (PCPE) | 1,130 | 0.15 | +0.09 | 0 | ±0 | |
| Liberal Democratic Centre (CDL) | 1,127 | 0.15 | +0.05 | 0 | ±0 | |
| Death to the System (+MAS+) | 791 | 0.11 | New | 0 | ±0 | |
| Party for the Regeneration of Democracy in Spain (PRDE) | 678 | 0.09 | New | 0 | ±0 | |
| Centre and Democracy Forum (CyD) | 528 | 0.07 | New | 0 | ±0 | |
| Republicans (RPS) | 485 | 0.07 | New | 0 | ±0 | |
| Communist Unification of Spain (UCE) | 465 | 0.06 | New | 0 | ±0 | |
| Blank ballots | 6,688 | 0.91 | +0.17 | |||
| Total | 734,686 | 10 | ±0 | |||
| Valid votes | 734,686 | 99.07 | –0.23 | |||
| Invalid votes | 6,868 | 0.93 | +0.23 | |||
| Votes cast / turnout | 741,554 | 74.11 | –5.47 | |||
| Abstentions | 259,070 | 25.89 | +5.47 | |||
| Registered voters | 1,000,624 | |||||
| Sources[8][24] | ||||||
Navarre
| Parties and coalitions | Popular vote | Seats | ||||
|---|---|---|---|---|---|---|
| Votes | % | ±pp | Total | +/− | ||
| Navarrese People's Union–People's Party (UPN–PP) | 126,516 | 38.21 | –1.01 | 2 | ±0 | |
| Spanish Socialist Workers' Party (PSOE) | 72,892 | 22.02 | –12.74 | 1 | –1 | |
| Amaiur (Amaiur) | 49,208 | 14.86 | New | 1 | +1 | |
| Yes to the Future (GBai)1 | 42,415 | 12.81 | –5.58 | 1 | ±0 | |
| Left: Plural Left (I–E (n))2 | 18,251 | 5.51 | +2.24 | 0 | ±0 | |
| Union, Progress and Democracy (UPyD) | 6,829 | 2.06 | +1.29 | 0 | ±0 | |
| Equo (Equo) | 3,656 | 1.10 | New | 0 | ±0 | |
| Pirate Party (Pirata) | 1,804 | 0.54 | New | 0 | ±0 | |
| For a Fairer World (PUM+J) | 1,393 | 0.42 | +0.25 | 0 | ±0 | |
| Internationalist Solidarity and Self-Management (SAIn) | 1,061 | 0.32 | +0.21 | 0 | ±0 | |
| Communist Unification of Spain (UCE) | 353 | 0.11 | New | 0 | ±0 | |
| Navarrese and Spanish Right (DNE) | 0 | 0.00 | New | 0 | ±0 | |
| Blank ballots | 6,707 | 2.03 | +0.56 | |||
| Total | 331,085 | 5 | ±0 | |||
| Valid votes | 331,085 | 98.41 | –0.90 | |||
| Invalid votes | 5,355 | 1.59 | +0.90 | |||
| Votes cast / turnout | 336,440 | 68.91 | –3.15 | |||
| Abstentions | 151,771 | 31.09 | +3.15 | |||
| Registered voters | 488,211 | |||||
| Sources[8][25] | ||||||
Valencian Community
| Parties and coalitions | Popular vote | Seats | ||||
|---|---|---|---|---|---|---|
| Votes | % | ±pp | Total | +/− | ||
| People's Party (PP) | 1,390,233 | 53.32 | +1.73 | 20 | +1 | |
| Spanish Socialist Workers' Party (PSOE) | 697,474 | 26.75 | –14.22 | 10 | –4 | |
| United Left of the Valencian Country–The Greens: Plural Left (EUPV–EV) | 169,786 | 6.51 | +3.80 | 1 | +1 | |
| Union, Progress and Democracy (UPyD) | 146,064 | 5.60 | +4.90 | 1 | +1 | |
| Bloc–Initiative–Greens–Equo: Commitment Coalition (Compromís–Q)1 | 125,306 | 4.81 | +3.73 | 1 | +1 | |
| Animalist Party Against Mistreatment of Animals (PACMA) | 12,508 | 0.48 | +0.33 | 0 | ±0 | |
| Spain 2000 (E–2000) | 9,266 | 0.36 | +0.22 | 0 | ±0 | |
| Republican Left of the Valencian Country (ERPV) | 7,450 | 0.29 | –0.05 | 0 | ±0 | |
| Communist Party of the Peoples of Spain (PCPE) | 4,427 | 0.17 | +0.11 | 0 | ±0 | |
| Blank Seats (EB) | 3,972 | 0.15 | New | 0 | ±0 | |
| Humanist Party (PH) | 3,003 | 0.12 | +0.09 | 0 | ±0 | |
| United for Valencia (UxV)2 | 2,210 | 0.08 | +0.03 | 0 | ±0 | |
| Republicans (RPS) | 2,036 | 0.08 | New | 0 | ±0 | |
| Communist Unification of Spain (UCE) | 1,980 | 0.08 | New | 0 | ±0 | |
| Liberal Democratic Centre (CDL) | 1,543 | 0.06 | +0.05 | 0 | ±0 | |
| Pirate Party (Pirata) | 1,001 | 0.04 | New | 0 | ±0 | |
| Internationalist Socialist Workers' Party (POSI) | 284 | 0.01 | –0.01 | 0 | ±0 | |
| Blank ballots | 28,785 | 1.10 | +0.25 | |||
| Total | 2,607,328 | 33 | ±0 | |||
| Valid votes | 2,607,328 | 98.80 | –0.53 | |||
| Invalid votes | 31,762 | 1.20 | +0.53 | |||
| Votes cast / turnout | 2,639,090 | 74.18 | –4.66 | |||
| Abstentions | 918,738 | 25.82 | +4.66 | |||
| Registered voters | 3,557,828 | |||||
| Sources[8][26] | ||||||
Autonomous cities
Ceuta
| Parties and coalitions | Popular vote | Seats | ||||
|---|---|---|---|---|---|---|
| Votes | % | ±pp | Total | +/− | ||
| People's Party (PP) | 20,968 | 65.93 | +10.82 | 1 | ±0 | |
| Spanish Socialist Workers' Party (PSOE) | 6,445 | 20.26 | –20.21 | 0 | ±0 | |
| Caballas Coalition (Caballas) | 1,712 | 5.38 | New | 0 | ±0 | |
| Union, Progress and Democracy (UPyD) | 1,061 | 3.34 | +2.02 | 0 | ±0 | |
| United Left–Democratic and Social Party of Ceuta: Plural Left (IU–PDSC) | 576 | 1.81 | +1.14 | 0 | ±0 | |
| The Greens–Green Group (LV–GV) | 293 | 0.92 | +0.32 | 0 | ±0 | |
| Animalist Party Against Mistreatment of Animals (PACMA) | 186 | 0.58 | +0.31 | 0 | ±0 | |
| For a Fairer World (PUM+J) | 65 | 0.20 | +0.08 | 0 | ±0 | |
| Blank ballots | 498 | 1.57 | +0.63 | |||
| Total | 31,804 | 1 | ±0 | |||
| Valid votes | 31,804 | 98.52 | –0.82 | |||
| Invalid votes | 478 | 1.48 | +0.82 | |||
| Votes cast / turnout | 32,282 | 53.16 | –10.16 | |||
| Abstentions | 28,441 | 46.84 | +10.16 | |||
| Registered voters | 60,723 | |||||
| Sources[8][27] | ||||||
Melilla
| Parties and coalitions | Popular vote | Seats | ||||
|---|---|---|---|---|---|---|
| Votes | % | ±pp | Total | +/− | ||
| People's Party (PP) | 17,828 | 66.71 | +17.68 | 1 | ±0 | |
| Spanish Socialist Workers' Party (PSOE) | 6,766 | 25.32 | –22.78 | 0 | ±0 | |
| Union, Progress and Democracy (UPyD) | 992 | 3.71 | +2.57 | 0 | ±0 | |
| Equo (Equo) | 427 | 1.60 | New | 0 | ±0 | |
| Animalist Party Against Mistreatment of Animals (PACMA) | 137 | 0.51 | New | 0 | ±0 | |
| For a Fairer World (PUM+J) | 80 | 0.30 | +0.20 | 0 | ±0 | |
| Blank ballots | 496 | 1.86 | +0.97 | |||
| Total | 26,726 | 1 | ±0 | |||
| Valid votes | 26,726 | 98.86 | –0.40 | |||
| Invalid votes | 308 | 1.14 | +0.40 | |||
| Votes cast / turnout | 27,034 | 49.43 | –14.25 | |||
| Abstentions | 27,656 | 50.57 | +14.25 | |||
| Registered voters | 54,690 | |||||
| Sources[8][28] | ||||||
References
- "20N/Elecciones Generales 2011". especiales.publico.es (in Spanish). Público. Retrieved 6 March 2017.
- "Elecciones Congreso. 20 de noviembre de 2011". elecciones.eldiario.es (in Spanish). eldiario.es. Retrieved 8 February 2020.
- Gallagher, Michael (30 July 2012). "Effective threshold in electoral systems". Trinity College, Dublin. Archived from the original on 30 July 2017. Retrieved 22 July 2017.CS1 maint: BOT: original-url status unknown (link)
- Carreras et al. 1989, pp. 1077.
- Reig Pellicer, Naiara (16 December 2015). "Spanish elections: Begging for the right to vote". cafebabel.co.uk. Retrieved 17 July 2017.
- "Constitución Española". Act of 29 December 1978. Boletín Oficial del Estado (in Spanish). Retrieved 27 December 2016.
- "Ley Orgánica 5/1985, de 19 de junio, del Régimen Electoral General". Organic Law No. 5 of 19 June 1985. Boletín Oficial del Estado (in Spanish). Retrieved 28 December 2016.
- "General election 20 November 2011". historiaelectoral.com (in Spanish). Electoral History. Retrieved 24 September 2017.
- "Electoral Results Consultation. Congress. November 2011. National totals". www.infoelectoral.mir.es (in Spanish). Ministry of the Interior. Retrieved 24 September 2017.
- "Electoral Results Consultation. Congress. November 2011. Andalusia". www.infoelectoral.mir.es (in Spanish). Ministry of the Interior. Retrieved 24 September 2017.
- "Electoral Results Consultation. Congress. November 2011. Aragon". www.infoelectoral.mir.es (in Spanish). Ministry of the Interior. Retrieved 24 September 2017.
- "Electoral Results Consultation. Congress. November 2011. Principality of Asturias". www.infoelectoral.mir.es (in Spanish). Ministry of the Interior. Retrieved 24 September 2017.
- "Electoral Results Consultation. Congress. November 2011. Balearic Islands". www.infoelectoral.mir.es (in Spanish). Ministry of the Interior. Retrieved 24 September 2017.
- "Electoral Results Consultation. Congress. November 2011. Basque Country". www.infoelectoral.mir.es (in Spanish). Ministry of the Interior. Retrieved 24 September 2017.
- "Electoral Results Consultation. Congress. November 2011. Canary Islands". www.infoelectoral.mir.es (in Spanish). Ministry of the Interior. Retrieved 24 September 2017.
- "Electoral Results Consultation. Congress. November 2011. Cantabria". www.infoelectoral.mir.es (in Spanish). Ministry of the Interior. Retrieved 24 September 2017.
- "Electoral Results Consultation. Congress. November 2011. Castile and León". www.infoelectoral.mir.es (in Spanish). Ministry of the Interior. Retrieved 24 September 2017.
- "Electoral Results Consultation. Congress. November 2011. Castilla–La Mancha". www.infoelectoral.mir.es (in Spanish). Ministry of the Interior. Retrieved 24 September 2017.
- "Electoral Results Consultation. Congress. November 2011. Catalonia". www.infoelectoral.mir.es (in Spanish). Ministry of the Interior. Retrieved 24 September 2017.
- "Electoral Results Consultation. Congress. November 2011. Extremadura". www.infoelectoral.mir.es (in Spanish). Ministry of the Interior. Retrieved 24 September 2017.
- "Electoral Results Consultation. Congress. November 2011. Galicia". www.infoelectoral.mir.es (in Spanish). Ministry of the Interior. Retrieved 24 September 2017.
- "Electoral Results Consultation. Congress. November 2011. La Rioja". www.infoelectoral.mir.es (in Spanish). Ministry of the Interior. Retrieved 24 September 2017.
- "Electoral Results Consultation. Congress. November 2011. Community of Madrid". www.infoelectoral.mir.es (in Spanish). Ministry of the Interior. Retrieved 24 September 2017.
- "Electoral Results Consultation. Congress. November 2011. Region of Murcia". www.infoelectoral.mir.es (in Spanish). Ministry of the Interior. Retrieved 24 September 2017.
- "Electoral Results Consultation. Congress. November 2011. Foral Community of Navarre". www.infoelectoral.mir.es (in Spanish). Ministry of the Interior. Retrieved 24 September 2017.
- "Electoral Results Consultation. Congress. November 2011. Valencian Community". www.infoelectoral.mir.es (in Spanish). Ministry of the Interior. Retrieved 24 September 2017.
- "Electoral Results Consultation. Congress. November 2011. Ceuta". www.infoelectoral.mir.es (in Spanish). Ministry of the Interior. Retrieved 24 September 2017.
- "Electoral Results Consultation. Congress. November 2011. Melilla". www.infoelectoral.mir.es (in Spanish). Ministry of the Interior. Retrieved 24 September 2017.
Bibliography
- Carreras, Albert; Tafunell, Xavier; Soler, Raimon; Fontana, Josep (2005) [1989]. Estadísticas históricas de España, siglos XIX-XX (PDF) (in Spanish). Volume 1 (II ed.). Bilbao: Fundación BBVA. pp. 1072–1097. ISBN 84-96515-00-1. Archived from the original (PDF) on 24 September 2015.
| General elections |
|
|---|---|
| Presidential elections | |
| European elections | |
| Local elections | |
| Regional elections | |
| Referendums | |
| |