Results breakdown of the 2007 Spanish local elections (Aragon)
This is the results breakdown of the local elections held in Aragon on 27 May 2007. The following tables show detailed results in the autonomous community's most populous municipalities, sorted alphabetically.[1][2][3]
Overall
| Parties and coalitions | Popular vote | Councillors | ||||
|---|---|---|---|---|---|---|
| Votes | % | ±pp | Total | +/− | ||
| Spanish Socialist Workers' Party (PSOE) | 260,667 | 38.51 | +1.67 | 1,822 | +96 | |
| People's Party (PP) | 204,120 | 30.15 | –0.78 | 1,103 | –193 | |
| Aragonese Party (PAR) | 94,079 | 13.90 | +1.87 | 983 | +76 | |
| Aragonese Union (CHA) | 58,463 | 8.64 | –3.82 | 228 | +32 | |
| United Left of Aragon (IU) | 30,453 | 4.50 | +0.98 | 47 | +9 | |
| The Greens–Federation of Independents of Aragon (LV–FIA)1 | 2,479 | 0.37 | +0.03 | 2 | +2 | |
| Commitment for Caspe (CPC) | 1,640 | 0.24 | +0.01 | 5 | ±0 | |
| Aragon United Citizens Party (pCUA) | 1,565 | 0.23 | New | 3 | +3 | |
| Liberal Democratic Centre (CDL) | 1,220 | 0.18 | New | 3 | +3 | |
| Anti-Bullfighting Party Against Mistreatment of Animals (PACMA) | 916 | 0.14 | New | 0 | ±0 | |
| The Greens–Green Group (LV–GV) | 803 | 0.12 | New | 1 | +1 | |
| Family and Life Party (PFyV) | 530 | 0.08 | –0.04 | 0 | ±0 | |
| For a Fairer World (PUM+J) | 521 | 0.08 | New | 0 | ±0 | |
| Others | 3,044 | 0.45 | — | 29 | –33 | |
| Blank ballots | 16,447 | 2.43 | +0.11 | |||
| Total | 676,947 | 100.00 | 4,226 | –4 | ||
| Valid votes | 676,947 | 99.14 | +0.04 | |||
| Invalid votes | 5,880 | 0.86 | –0.04 | |||
| Votes cast / turnout | 682,827 | 66.65 | –4.03 | |||
| Abstentions | 341,687 | 33.35 | +4.03 | |||
| Registered voters | 1,024,514 | |||||
| Sources[1][4] | ||||||
City control
The following table lists party control in the most populous municipalities, including provincial capitals (shown in bold).[1] Gains for a party are displayed with the cell's background shaded in that party's colour.
| Municipality | Population | Previous control | New control | ||
|---|---|---|---|---|---|
| Calatayud | 20,001 | People's Party (PP) | Spanish Socialist Workers' Party (PSOE) | ||
| Huesca | 49,312 | Spanish Socialist Workers' Party (PSOE) | Spanish Socialist Workers' Party (PSOE) | ||
| Teruel | 33,673 | Spanish Socialist Workers' Party (PSOE) | Aragonese Party (PAR) (PP in 2010)[5] | ||
| Zaragoza | 646,546 | Spanish Socialist Workers' Party (PSOE) | Spanish Socialist Workers' Party (PSOE) | ||
Municipalities
Calatayud
- Population: 20,001
 | ||||||
| Parties and coalitions | Popular vote | Seats | ||||
|---|---|---|---|---|---|---|
| Votes | % | ±pp | Total | +/− | ||
| People's Party (PP) | 4,309 | 42.84 | –12.85 | 9 | –2 | |
| Spanish Socialist Workers' Party (PSOE) | 2,660 | 26.45 | +1.84 | 6 | +2 | |
| Aragonese Party (PAR) | 1,777 | 17.67 | +13.36 | 4 | +4 | |
| Aragonese Union (CHA) | 938 | 9.33 | –2.15 | 2 | ±0 | |
| United Left of Aragon (IU) | 138 | 1.37 | –0.39 | 0 | ±0 | |
| Blank ballots | 236 | 2.35 | +0.19 | |||
| Total | 10,058 | 21 | +4 | |||
| Valid votes | 10,058 | 99.29 | +0.89 | |||
| Invalid votes | 72 | 0.71 | –0.89 | |||
| Votes cast / turnout | 10,130 | 69.35 | –2.18 | |||
| Abstentions | 4,478 | 30.65 | +2.18 | |||
| Registered voters | 14,608 | |||||
| Sources[1][6][7] | ||||||
Huesca
- Population: 49,312
 | ||||||
| Parties and coalitions | Popular vote | Seats | ||||
|---|---|---|---|---|---|---|
| Votes | % | ±pp | Total | +/− | ||
| Spanish Socialist Workers' Party (PSOE) | 8,907 | 38.44 | –9.50 | 9 | –3 | |
| People's Party (PP) | 7,459 | 32.19 | +4.75 | 7 | +1 | |
| Aragonese Union (CHA) | 2,092 | 9.03 | –0.83 | 2 | ±0 | |
| Aragonese Party (PAR) | 1,906 | 8.23 | +0.39 | 2 | +1 | |
| United Left of Aragon (IU) | 1,338 | 5.77 | +1.67 | 1 | +1 | |
| The Greens–Green Group (LV–GV) | 753 | 3.25 | New | 0 | ±0 | |
| Family and Life Party (PFyV) | 45 | 0.19 | –0.05 | 0 | ±0 | |
| Blank ballots | 672 | 2.90 | +0.53 | |||
| Total | 23,172 | 21 | ±0 | |||
| Valid votes | 23,172 | 99.34 | +0.18 | |||
| Invalid votes | 155 | 0.66 | –0.18 | |||
| Votes cast / turnout | 23,327 | 60.45 | –4.11 | |||
| Abstentions | 15,263 | 39.55 | +4.11 | |||
| Registered voters | 38,590 | |||||
| Sources[1][6][8] | ||||||
Teruel
- Population: 33,673
 | ||||||
| Parties and coalitions | Popular vote | Seats | ||||
|---|---|---|---|---|---|---|
| Votes | % | ±pp | Total | +/− | ||
| People's Party (PP) | 5,909 | 35.58 | –1.00 | 8 | ±0 | |
| Spanish Socialist Workers' Party (PSOE) | 5,170 | 31.13 | –2.26 | 7 | –1 | |
| Aragonese Party (PAR) | 2,741 | 16.51 | +0.09 | 4 | ±0 | |
| Aragonese Union (CHA) | 1,423 | 8.57 | +1.73 | 2 | +1 | |
| United Left of Aragon (IU) | 806 | 4.85 | +0.82 | 0 | ±0 | |
| Aragon United Citizens Party (pCUA) | 115 | 0.69 | New | 0 | ±0 | |
| Family and Life Party (PFyV) | 30 | 0.18 | –0.04 | 0 | ±0 | |
| Blank ballots | 413 | 2.49 | +0.24 | |||
| Total | 16,607 | 21 | ±0 | |||
| Valid votes | 16,607 | 99.03 | –0.02 | |||
| Invalid votes | 163 | 0.97 | +0.02 | |||
| Votes cast / turnout | 16,770 | 63.94 | –4.45 | |||
| Abstentions | 9,457 | 36.06 | +4.45 | |||
| Registered voters | 26,227 | |||||
| Sources[1][6][9] | ||||||
Zaragoza
- Population: 646,546
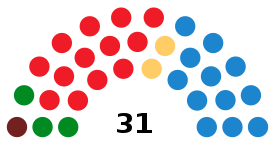 | ||||||
| Parties and coalitions | Popular vote | Seats | ||||
|---|---|---|---|---|---|---|
| Votes | % | ±pp | Total | +/− | ||
| Spanish Socialist Workers' Party (PSOE) | 115,723 | 38.06 | +4.16 | 13 | +1 | |
| People's Party (PP) | 103,191 | 33.94 | +1.28 | 12 | +1 | |
| Aragonese Union (CHA) | 29,230 | 9.61 | –8.73 | 3 | –3 | |
| Aragonese Party (PAR) | 25,410 | 8.36 | +1.37 | 2 | ±0 | |
| United Left of Aragon (IU) | 16,148 | 5.31 | +1.34 | 1 | +1 | |
| The Greens–Federation of Independents of Aragon (LV–FIA)1 | 2,078 | 0.68 | –0.03 | 0 | ±0 | |
| Aragon United Citizens Party (pCUA) | 1,192 | 0.39 | New | 0 | ±0 | |
| Anti-Bullfighting Party Against Mistreatment of Animals (PACMA) | 916 | 0.30 | New | 0 | ±0 | |
| Liberal Democratic Centre (CDL) | 525 | 0.17 | New | 0 | ±0 | |
| For a Fairer World (PUM+J) | 521 | 0.17 | New | 0 | ±0 | |
| Family and Life Party (PFyV) | 455 | 0.15 | –0.07 | 0 | ±0 | |
| Humanist Party (PH) | 241 | 0.08 | +0.01 | 0 | ±0 | |
| Blank ballots | 8,415 | 2.77 | +0.25 | |||
| Total | 304,045 | 31 | ±0 | |||
| Valid votes | 304,045 | 99.45 | +0.01 | |||
| Invalid votes | 1,677 | 0.55 | –0.01 | |||
| Votes cast / turnout | 305,722 | 60.11 | –6.08 | |||
| Abstentions | 202,921 | 39.89 | +6.08 | |||
| Registered voters | 508,643 | |||||
| Sources[1][6][10][11] | ||||||
See also
References
- "Municipal elections in Aragon and La Rioja since 1979". historiaelectoral.com (in Spanish). Electoral History. Retrieved 30 September 2017.
- "Elecciones Municipales. 27 de mayo de 2007. Aragón". elecciones.eldiario.es (in Spanish). eldiario.es. Retrieved 7 June 2019.
- "27M/Elecciones Municipales 2007. Aragón". especiales.publico.es (in Spanish). Público. Retrieved 28 October 2018.
- "Electoral Results Consultation. Municipal. May 2007. Aragon". www.infoelectoral.mir.es (in Spanish). Ministry of the Interior. Retrieved 13 January 2019.
- "Blasco (PP), elegido alcalde de Teruel en medio de los reproches del PSOE al PAR". Heraldo de Aragón (in Spanish). 18 November 2010. Retrieved 5 July 2020.
- "Local election results, 27 May 2007" (PDF). www.juntaelectoralcentral.es (in Spanish). Central Electoral Commission. Retrieved 16 February 2018.
- "Electoral Results Consultation. Municipal. May 2007. Calatayud Municipality". www.infoelectoral.mir.es (in Spanish). Ministry of the Interior. Retrieved 19 March 2018.
- "Electoral Results Consultation. Municipal. May 2007. Huesca Municipality". www.infoelectoral.mir.es (in Spanish). Ministry of the Interior. Retrieved 19 March 2018.
- "Electoral Results Consultation. Municipal. May 2007. Teruel Municipality". www.infoelectoral.mir.es (in Spanish). Ministry of the Interior. Retrieved 19 March 2018.
- "Electoral Results Consultation. Municipal. May 2007. Zaragoza Municipality". www.infoelectoral.mir.es (in Spanish). Ministry of the Interior. Retrieved 19 March 2018.
- "Municipal elections in Zaragoza since 1979". historiaelectoral.com (in Spanish). Electoral History. Retrieved 24 February 2018.
| Regional elections | |
|---|---|
| General elections | |
| European Parliament elections | |
| Local elections | |
This article is issued from Wikipedia. The text is licensed under Creative Commons - Attribution - Sharealike. Additional terms may apply for the media files.