2000 United States presidential election in Massachusetts
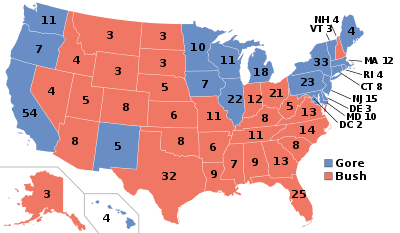
The 2000 United States presidential election in Massachusetts took place on November 7, 2000, and was part of the 2000 United States presidential election. Voters chose 12 representatives, or electors to the Electoral College, who voted for president and vice president.
| |||||||||||||||||||||||||||||||||
| |||||||||||||||||||||||||||||||||
 County Results
Gore 50–60%
60–70%
70–80% | |||||||||||||||||||||||||||||||||
| |||||||||||||||||||||||||||||||||


Massachusetts is one of the most reliable blue states in the nation: no Republican has won the state since Ronald Reagan in 1984. The 2000 presidential election featured Democratic United States Vice President Al Gore versus Republican Texas Governor George W. Bush. Despite Bush's tight victory nationwide, Gore handily won Massachusetts, with a 27% margin of victory against George W. Bush who did not actively campaign there. Gore won every county and congressional district. Massachusetts had been a Democratic-leaning state since 1928, and a Democratic stronghold since 1960, and has kept up its intense level of the sizable Democratic margins since 1996.
Results
Vice President Al Gore easily defeated Texas Governor George W. Bush in Massachusetts. Massachusetts is one of the most reliable Democratic States in the union. Gore won every single county in Massachusetts.
With 6.42% of the popular vote, Massachusetts proved to be Ralph Nader's third best state in the 2000 election after Alaska and neighboring Vermont.[1]
| 2000 United States presidential election in Massachusetts | |||||
|---|---|---|---|---|---|
| Party | Candidate | Votes | Percentage | Electoral votes | |
| Democratic | Al Gore | 1,616,487 | 59.80% | 12 | |
| Republican | George W. Bush | 878,502 | 32.50% | 0 | |
| Green | Ralph Nader | 173,564 | 6.42% | 0 | |
| Libertarian | Harry Browne | 16,366 | 0.61% | 0 | |
| Reform | Pat Buchanan | 11,149 | 0.41% | 0 | |
| Independent | Others (Write-In) | 3,990 | 0.15% | 0 | |
| Independent (a) | John Hagelin | 2,884 | 0.11% | 0 | |
| Socialist | David McReynolds (Write-In) | 42 | 0.15% | 0 | |
| Totals | 2,702,984 | 100.0% | 12 | ||
(a) John Hagelin was the candidate of the Natural Law Party nationally.
Results breakdown
By county
| County | Gore% | Gore# | Bush% | Bush# | Others% | Others# | Total |
|---|---|---|---|---|---|---|---|
| Barnstable | 51.50% | 62,363 | 41.03% | 49,686 | 7.46% | 9,037 | 121,086 |
| Berkshire | 63.85% | 37,934 | 26.60% | 15,805 | 9.55% | 5,672 | 59,411 |
| Bristol | 64.51% | 136,325 | 29.74% | 62,848 | 5.76% | 12,164 | 211,337 |
| Dukes | 61.81% | 5,474 | 26.14% | 2,315 | 12.05% | 1,067 | 8,856 |
| Essex | 57.49% | 178,400 | 35.45% | 110,010 | 7.06% | 21,923 | 310,333 |
| Franklin | 53.78% | 17,945 | 30.50% | 10,176 | 15.72% | 5,245 | 33,366 |
| Hampden | 58.17% | 100,103 | 34.61% | 59,558 | 7.22% | 12,432 | 172,093 |
| Hampshire | 56.16% | 38,543 | 27.98% | 19,202 | 15.86% | 10,881 | 68,626 |
| Middlesex | 61.49% | 404,043 | 30.27% | 198,914 | 8.23% | 54,091 | 657,048 |
| Nantucket | 58.34% | 2,874 | 32.97% | 1,624 | 8.69% | 428 | 4,926 |
| Norfolk | 59.41% | 188,450 | 33.75% | 107,033 | 6.84% | 21,694 | 317,177 |
| Plymouth | 54.53% | 115,376 | 39.11% | 82,751 | 6.36% | 13,450 | 211,577 |
| Suffolk | 71.38% | 154,888 | 20.48% | 44,441 | 8.14% | 17,671 | 217,000 |
| Worcester | 56.02% | 173,679 | 36.81% | 114,139 | 7.17% | 22,240 | 310,058 |
Results by Congressional district
Gore won all 10 Congressional districts.
| District | Bush | Gore | Nader | Representative |
|---|---|---|---|---|
| 1st | 33% | 57% | 9% | John Olver |
| 2nd | 34% | 58% | 7% | Richard Neal |
| 3rd | 35% | 58% | 6% | Jim McGovern |
| 4th | 30% | 63% | 5% | Barney Frank |
| 5th | 36% | 56% | 6% | Marty Meehan |
| 6th | 36% | 57% | 6% | John F. Tierney |
| 7th | 29% | 63% | 6% | Ed Markey |
| 8th | 17% | 72% | 10% | Mike Capuano |
| 9th | 31% | 62% | 6% | Joe Moakley |
| Stephen F. Lynch | ||||
| 10th | 38% | 55% | 6% | Bill Delahunt |
Results by municipality

References
- "2000 Presidential Election Statistics". Dave Leip’s Atlas of U.S. Presidential Elections. Retrieved 2018-03-05.
See also
State and district results of the 2000 United States presidential election | ||
|---|---|---|
|  | |